MRI in Clinical Trials of Multiple System Atrophy (MSA)
This resource provides an overview of the utility of volumetric MRI and diffusion-weighted imaging (DWI) as biomarkers in research studies of MSA.
How can imaging be used for eligibility, safety, and efficacy assessments in MSA clinical trials?
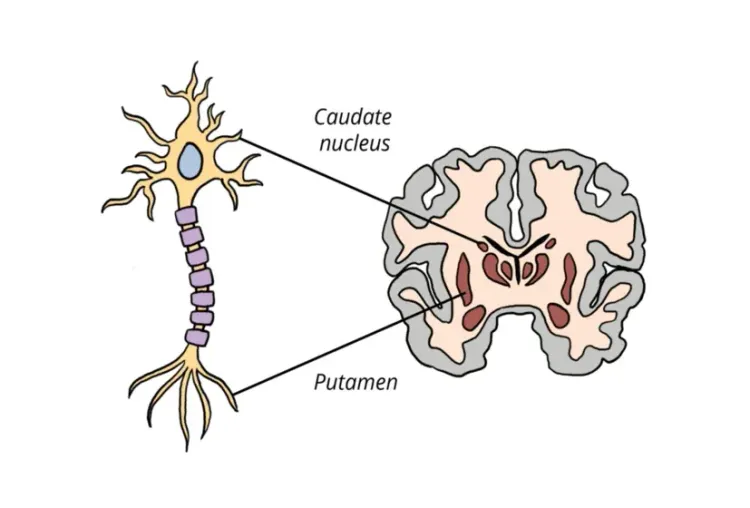
Multiple system atrophy (MSA) is a sporadic, rapidly progressive, adult-onset neurodegenerative disorder that manifests clinically as a diverse combination of parkinsonism, cerebellar ataxia, and autonomic dysfunction (Liu, 2024). It is pathologically characterized by cytoplasmic inclusions containing abnormally aggregated alpha-synuclein in oligodendrocytes and neurons (Liu, 2024). Based on clinical symptoms, MSA can be classified into a Parkinsonian subtype (MSA-P) and a Cerebellar subtype (MSA-C). According to the Movement Disorder Society (MDS) diagnostic criteria for MSA, the diagnosis of clinically established MSA requires the manifestation of autonomic dysfunction in combination with poorly levodopa responsive parkinsonism and/ or cerebellar syndrome (Zhang, 2023).
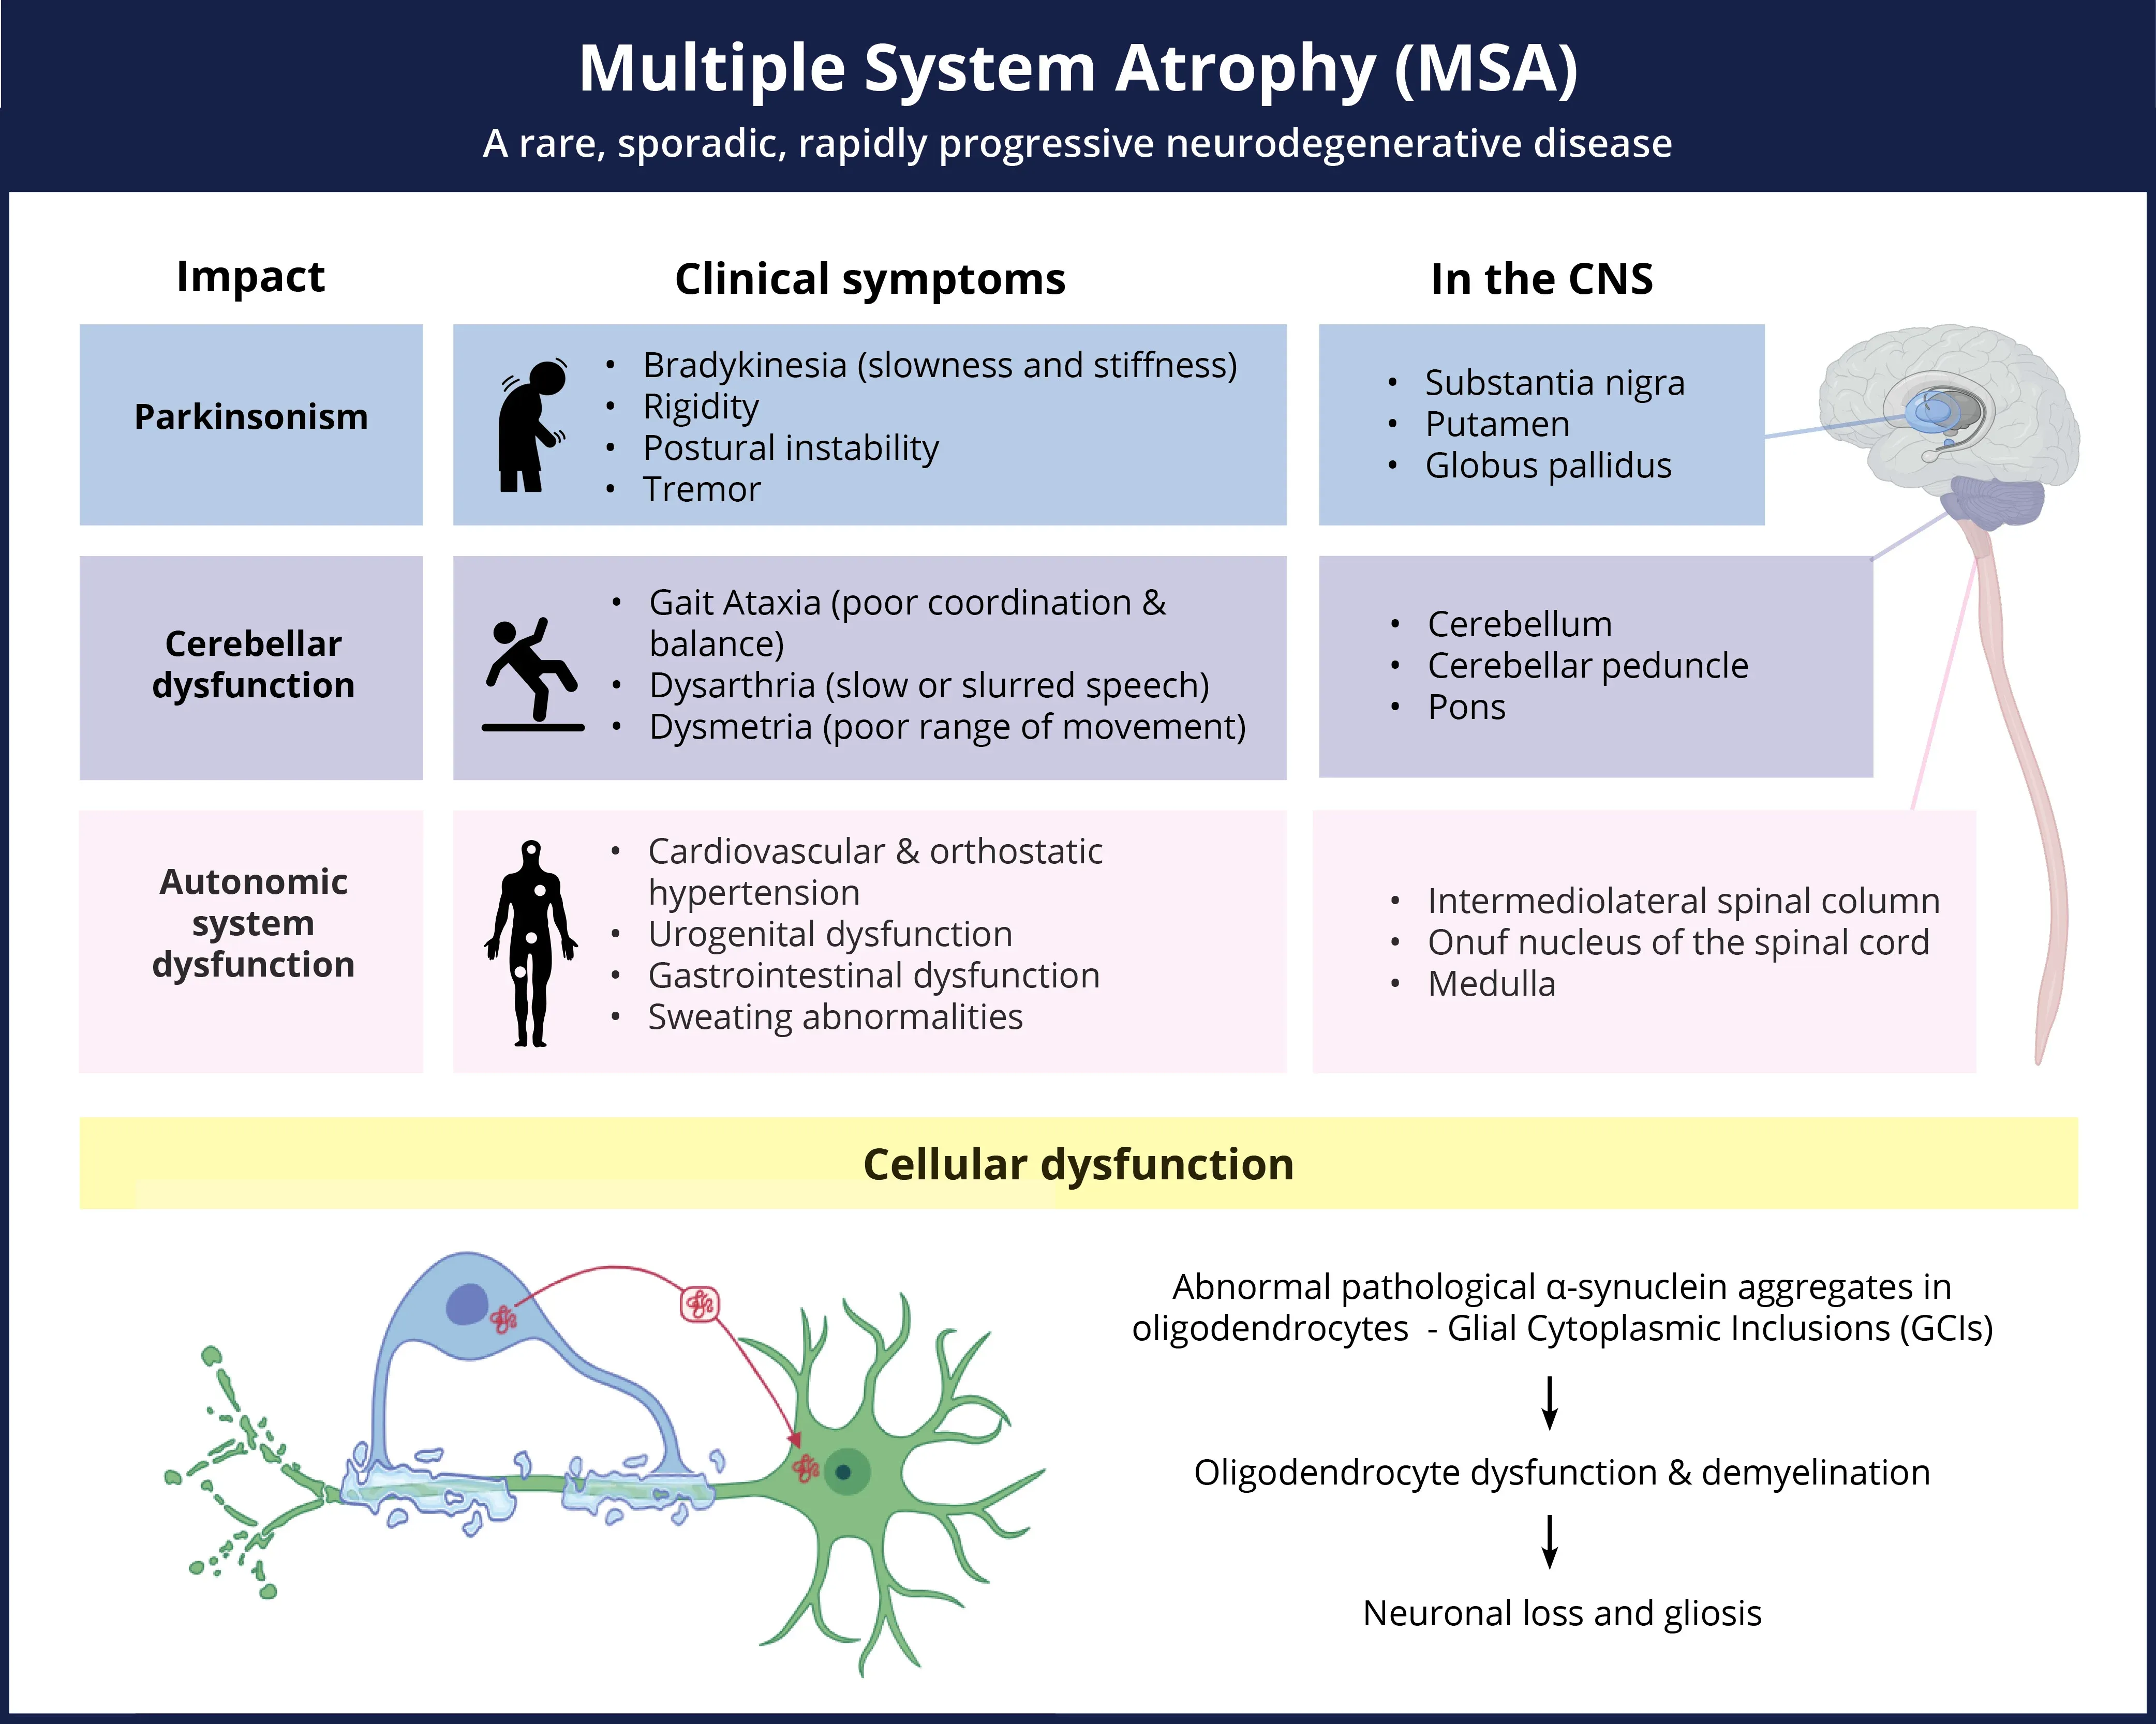
Multiple System Atrophy (MSA) is a complex, rare disease which manifests with a range of symptoms and pathologic changes throughout the CNS.
 Click to copy link
To date, clear diagnosis of MSA compared to other potential parkinsonian disorders (Parkinson’s Disease [PD] and Progressive Supranuclear Palsy [PSP]) remains challenging. Definitive MSA diagnosis can only be reached with post-mortem confirmation of Glial Cytoplasmic Inclusions (GCIs) in a well-defined spatial pattern (Chelban, 2019). However, the use of multiple MRI modalities is becoming increasingly reliable for obtaining more accurate diagnoses compared to relying solely on clinical disease rating scores (Quattrone, 2008). Once a diagnosis of MSA has been reached, distinguishing between the two clinical forms of the MSA can result in more targeted and appropriate treatment. Currently, the low sensitivity of MSA diagnosis excludes many patients from clinical trials of potential disease-modifying therapies. Consequently, earlier and more accurate diagnosis via imaging measures could increase participation in life-altering trials and open new research opportunities in identifying earlier biomarkers.
Moreover, imaging can identify other clinically significant evidence of malignant, ischemic, hemorrhagic, demyelinating, structural, or degenerative brain diseases that are not associated with MSA. This process is vital in identifying potential issues that could compromise patient safety during a clinical trial. Safety and eligibility reads are often recommended as clinical study inclusion criteria and rely heavily on imaging biomarkers. Any indication of an alternative diagnosis, such as PSP, multiple sclerosis (MS), vascular parkinsonism, and symptomatic cerebellar disease should be accurately identified to ensure proper exclusion from trials.
Longitudinal analysis of imaging data identifies relationships between MRI findings and the severity or duration of the disease in patients with MSA (Kim, 2017). Quantitative image analysis based on MR images, particularly within specific regions-of-interest (ROIs), can evaluate the efficacy of disease-modifying treatments in patients with MSA. Previous research has demonstrated a correlation between clinical scores and imaging biomarker progression (Krismer, 2024), where specifically selected structural and diffusion measures can be utilized to track disease progression in MSA clinical trials (Raghavan, 2024).
Which MRI biomarkers can be used to assess brain atrophy in MSA?
MRI biomarkers are increasingly used in clinical trials to assess brain atrophy in MSA. Most known biomarkers can be generated from T1- or T2-weighed anatomical MRI scans. 3D T1-weighted (3D T1W) MRI scans are predominantly used in clinical trials for the assessment of atrophy. Brain atrophy is prominent in neurological diseases, including MSA, and is characterized by a loss of neurons and connections between neurons (Andravizou, 2019). Diagnosis of neurological conditions can be facilitated by identifying regions with significant atrophy, and the current MSA diagnostic criteria require imaging evidence to establish clinical MSA (Liu, 2024). In addition to diagnostic use, longitudinal quantification of the atrophy in these vulnerable regions can be used to follow disease progression and evaluation of treatment efficacy.
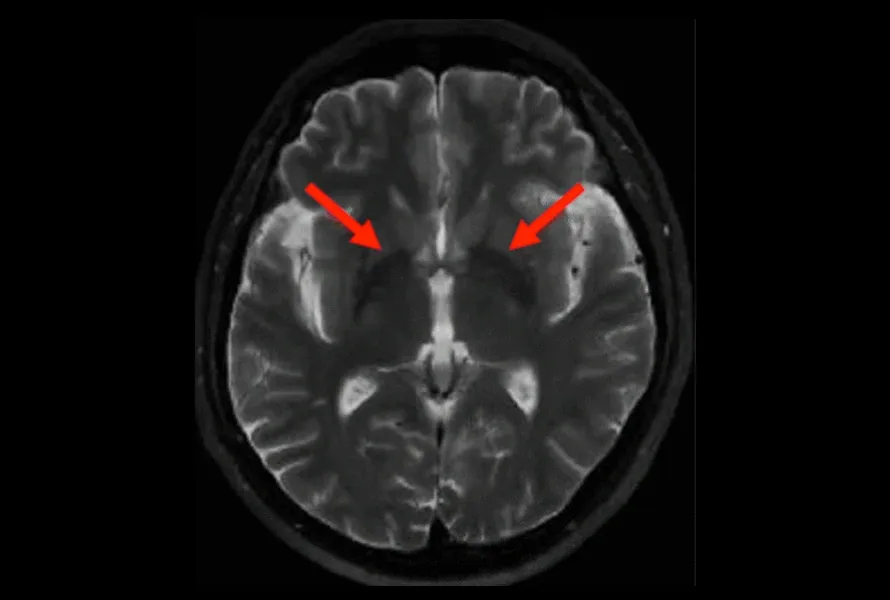
T2-weighted MR image showing putamen atrophy in an MSA subject (red arrows).
Radiological Signs
Putamen Atrophy and Hypointensity
Disproportionate atrophy in the putamen is a defining feature of both MSA-C and MSA-P, and can help differentiate MSA from other neurological conditions. Additionally, discontinuity or irregular disruption of the hypointense putaminal rim (HPR) is increasingly used as an MSA-P indicator (Kim, 2017). Previously, only the presence of an HPR was used as an imaging marker, but, with the increasingly common use of 3T scanners, it has been proven to be non-specific and a normal finding on T2-weighted images. Rather, its disruption has been identified as an important finding in MSA. Further, recommendations have been made to add a FLAIR acquisition to confirm discontinuity or irregular disruption of HPR (Lee, 2005).
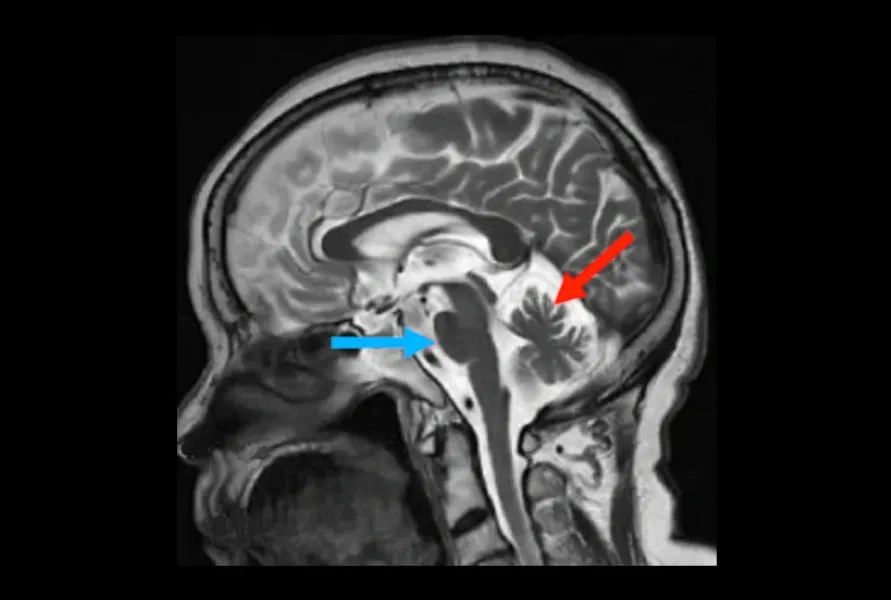
T2-weighted MR images showing pontine atrophy (blue arrow) and cerebellar atrophy in an MSA subject (red arrow).
Cerebellum, Pons, and Brainstem Atrophy
While it can be difficult to differentiate between MSA-C and MSA-P due to substantial overlap of affected regions, the presence of atrophy in the cerebellum and pons is highly prevalent in MSA-C and becomes more prominent as the disease progresses, thus facilitating the identification of the subtypes (Gilman, 2008).
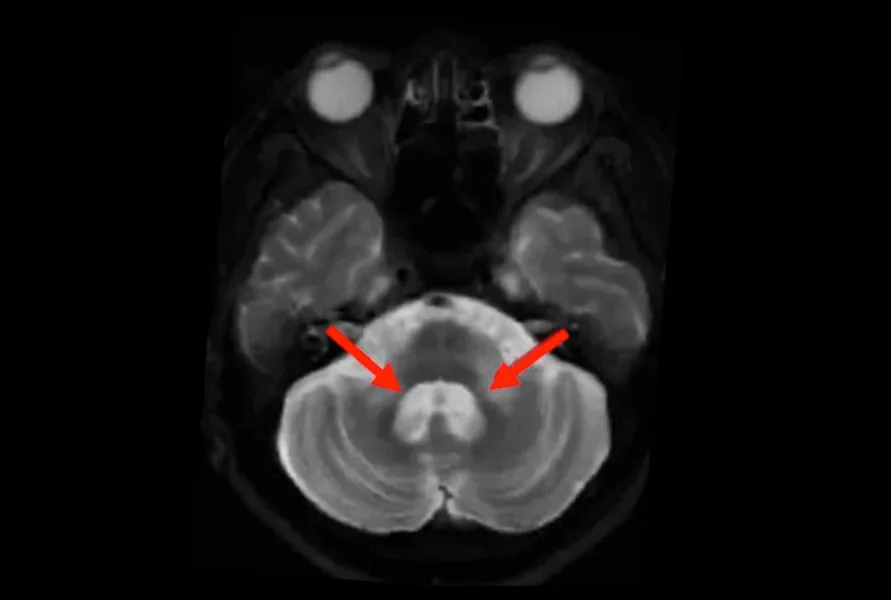
T2-weighted MR images showing hyperintense signal and atrophy in MCP of an MSA subject (red arrows).
Middle Cerebellar Peduncle (MCP) Hyperintensity & Atrophy
A hyperintense T2-weighted signal in the pontocerebellar tracts (pons, middle cerebellar peduncle, and cerebellum) reflects degeneration of the white matter tracts that connect the cerebellum to the brainstem. This particular sign can help differentiate MSA from other diseases (Jiang, 2024).
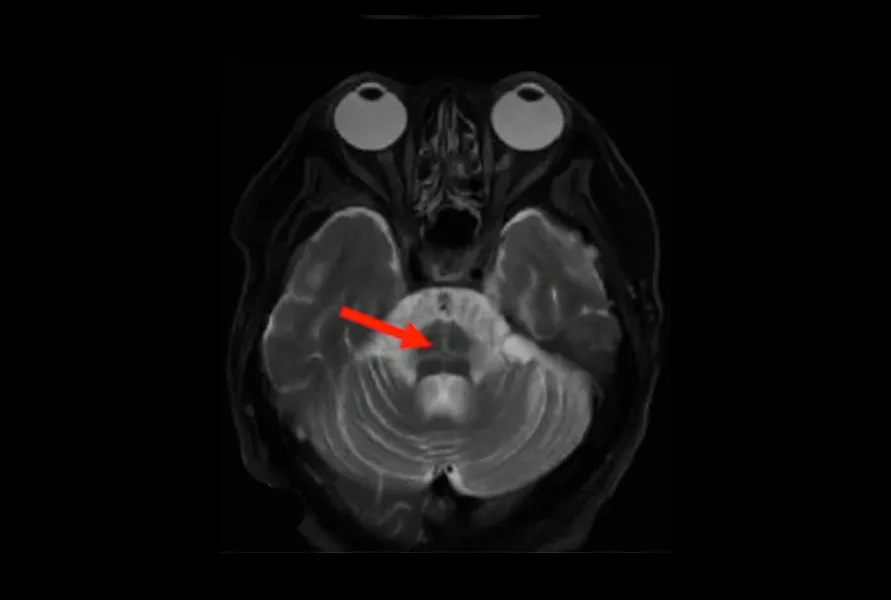
T2-weighted MR images showing the hot cross bun sign in the pons of an MSA subject (red arrow).
Hot Cross Bun Sign
Another common MRI biomarker in MSA-C, known as the “hot cross bun sign”, is characterized by cruciate hyperintensity secondary to atrophy of the transverse pontine fibers (Vijayan, 2008). It arises from the degeneration of the pons and pontocerebellar fibers with the preservation of corticospinal tract and appears as a hyperintense cross in the pons on T2-weighted images (Chelban, 2019).
Images adapted from Liu, 2024 under the Creative Commons Attribution License.
Quantitative Measures of Regional Atrophy
Quantitative volumetric measurements obtained from anatomical MRI serve as a powerful imaging biomarker of regional atrophy, and are a critical for both diagnosis and monitoring of disease progression. Leveraging quantitative biomarkers in clinical trials, particularly by monitoring longitudinal change in volumetric measurements, allows for detailed insight into both the biological progression and therapeutic effects.
Given the high costs and intricate nature of clinical trials, the ability to detect change in the shortest possible time frame is crucial. Focusing on brain structures most affected by the disease is essential for early detection of treatment effects. In the context of MSA, atrophy of the putamen, pons, and middle cerebellar peduncle (MCP) can be utilized to identify this clinical population and monitor progression. Moreover, significant atrophy in the cerebellum is strongly associated with MSA-C, which can help differentiate the subtypes of MSA (Gilman, 2008).
In order to detect change in clinical trial populations, the accuracy (how close the measured value is to the true value) and precision (how reproducible a measurement is) with which disease biomarkers can be quantified, play an important role in clinical trial design. Clearly, the desirable processes and systems produce both accurate and precise results. There are, however, many sources of measurement variability in neuroimaging biomarkers that can be difficult to quantify and control. Apart from biological variability (i.e. differences between subjects), the methodological variability inherent in medical image acquisition and analysis also plays a prominent role. Utilizing Biospective’s image processing platform, we evaluated our test-retest reliability on a cohort of data from the Parkinson's Progression Markers Initiative (PPMI; ppmi-info.org), and compared results with the analyses derived from FreeSurfer (a powerful, freely available, open-source neuroimaging analysis platform) given its widespread use by the academic research community. The data illustrated in the tables and graphs below clearly show the reduced methodological variability of the Biospective platform, which was purpose-built and continually fine-tuned for neuroimaging in clinical trials. This reduced variability has a direct effect on the ability to detect change in the imaging data and study sample size requirements.
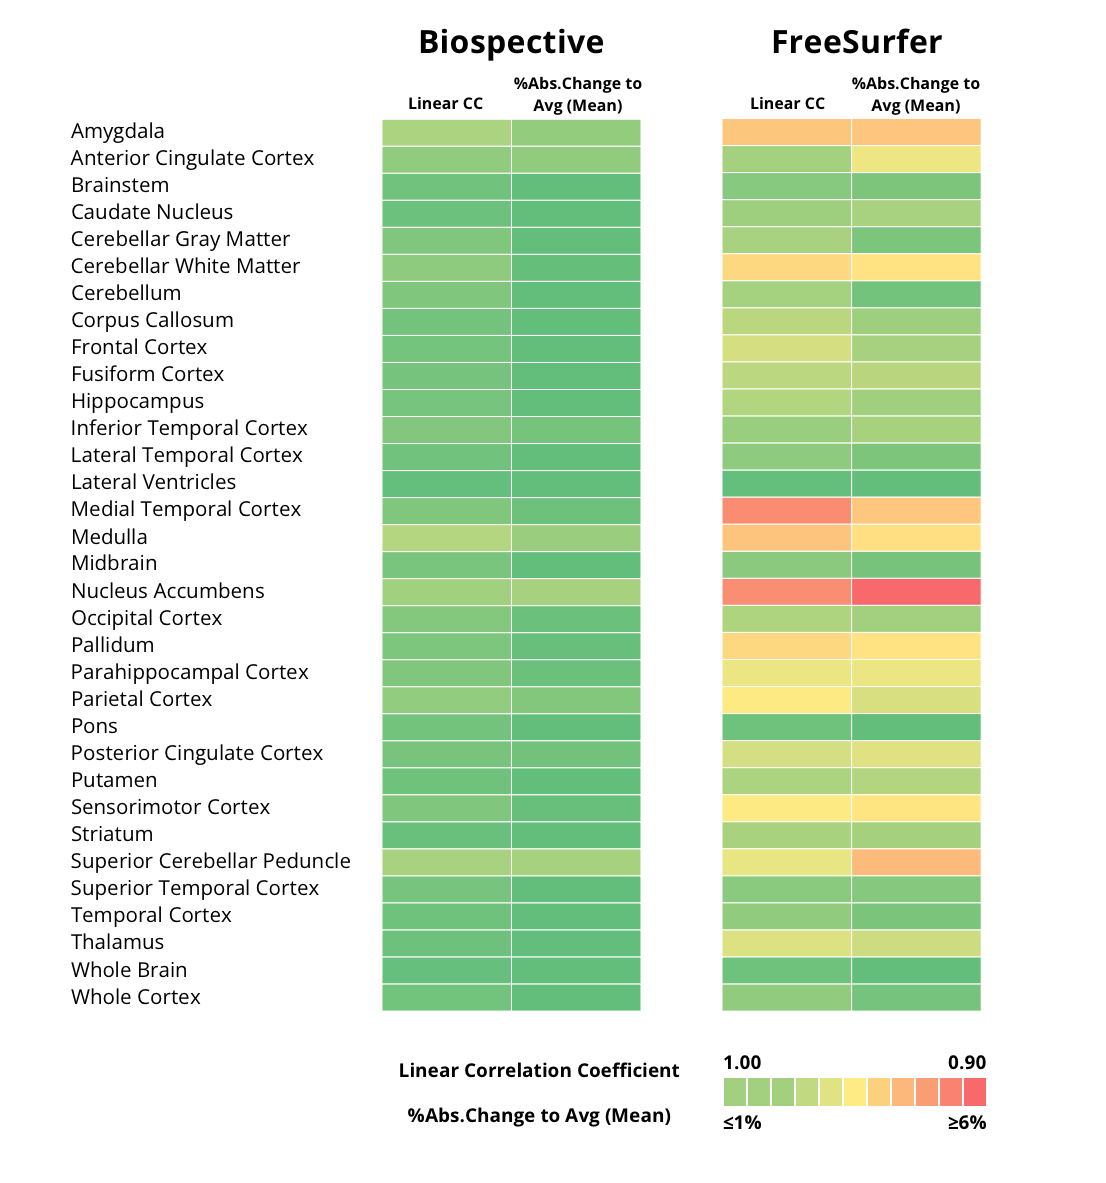
Test-retest correlation was performed on data from PPMI. Two acquisitions were performed within the same scanning session, and only independent pairs of scans that passed image quality control (QC) review and had matched acquisition parameters were utilized for the analysis (N=243). We used FreeSurfer for comparison. The table indicates both the Biospective and FreeSurfer linear correlation coefficients (Linear CC) between tests, as well as the % abs change relative to mean for a set of cortical and subcortical regions. Note that green indicates a higher correlation coefficient and lower % abs. change to avg.
Test-retest correlation scatterplots between Biospective (blue) and FreeSurfer (red) analysis graphically illustrate correlations between each individual subject scan on the x-axis and the repeat scan on the y-axis. Note the reduced scatter across all the regions assessed in the Biospective test-retest plots.
Is Diffusion-Weighted Imaging (DWI) useful as a biomarker in MSA studies?
DWI is based on measuring the random Brownian motion (erratic random movement of microscopic particles in fluid) of water molecules within a voxel of tissue. DWI relies on the random movement of water protons, which diffuse freely in extracellular space, but are restricted in intracellular space (Kawahara, 2021). This MRI modality has a role in identification of multiple clinical findings, including but not limited to stroke, cortical lesions, herpes encephalitis, and demyelination.
For MSA diagnosis, given that random movement of water molecules is increased in neurodegeneration and ischemia (Chelban, 2019), DWI provides useful biomarkers. DWI identifies microstructural damage in the brain, which conventional MRI cannot detect, using quantification of water molecule motion (Kim, 2017).
Using DWI, increased diffusivity in both the putamen and middle cerebellar peduncle are strong indicators of MSA. Notably, apparent diffusion coefficient (ADC) maps show higher diffusivity in the pons, cerebellum, and putamen compared with PD subjects or health controls, while fractional anisotropy (FA) is lower in those same areas (Dąbrowska, 2015) . Commonly used additional measures are axial diffusivity (AD), radial diffusivity (RD), and mean diffusivity (MD), which help assess white matter changes in MSA better than standard MRI sequences. For example, the transverse pontocerebellar fibres, the corticospinal tracts, the pons, and the cerebellum show an increased MD (Loh, 2011).
In clinical trials, DWI alterations can correlate with the duration or severity of the disease in patients. Diagnosis is increasingly relying on DWI measures (Meyyappan, 2024). However, longitudinal evaluations using multimodal MRI approaches combining volumetric measurements, DWI, and iron-sensitive sequences can further improve diagnosis and disease progression tracking.
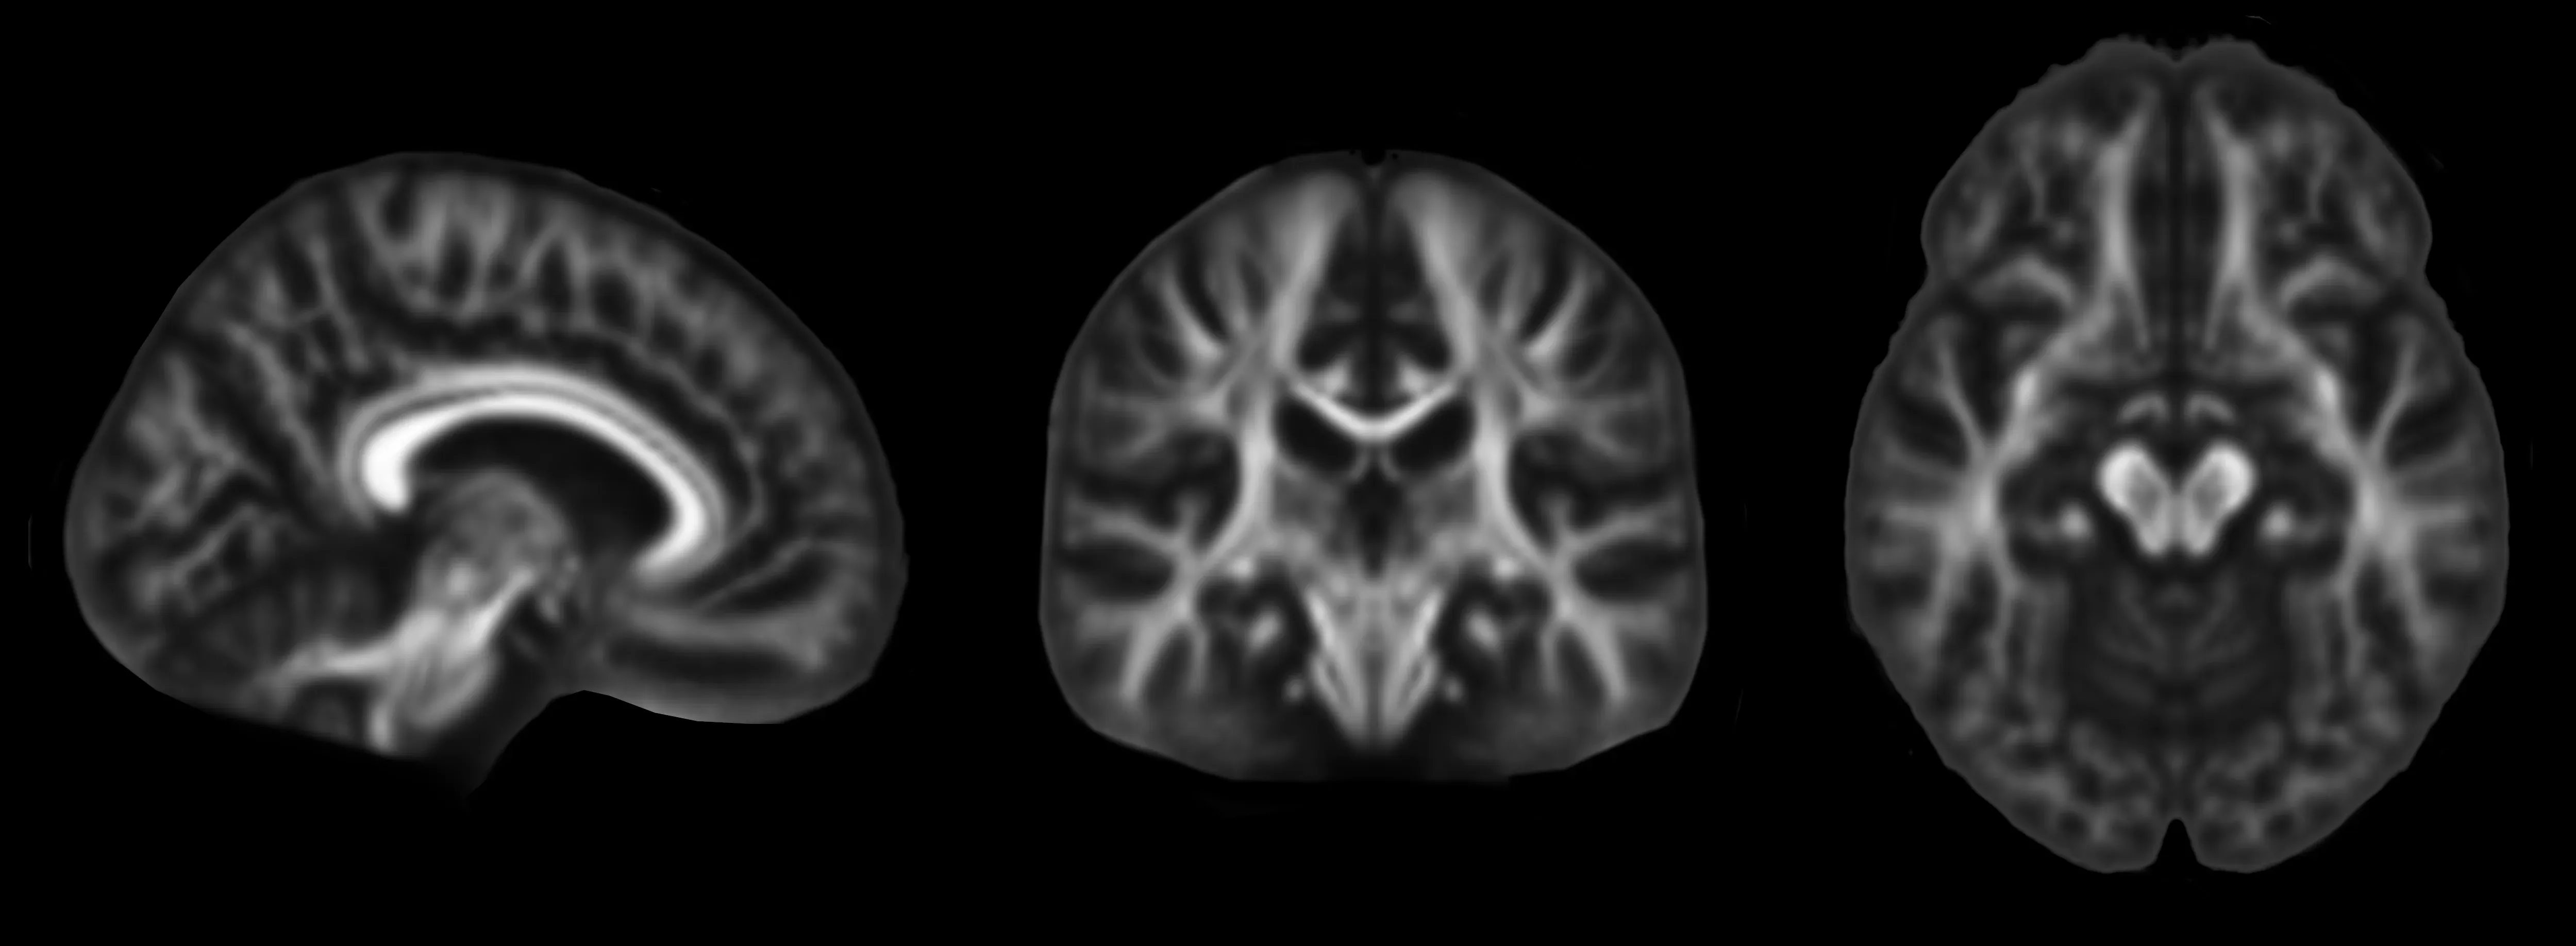
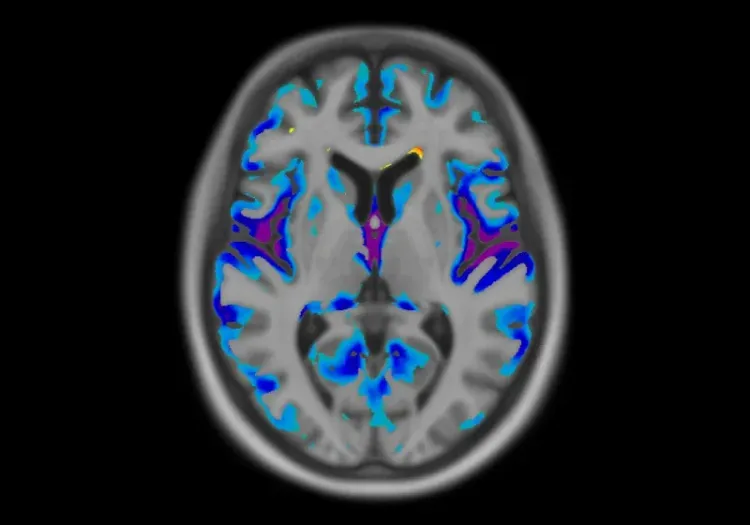
Orthogonal views of fractional anisotropy (FA) maps derived from DTI data.
Our team would be happy to answer any questions about MRI in Clinical Trials of Multiple System Atrophy or provide specific information about our other Imaging services.
Discover more about our Imaging Services
Related Content
Up-to-date information on best practices related to the use of neuroimaging in clinical trials of neurological diseases.
Spinocerebellar Ataxia Clinical Trials & Imaging Biomarkers
An overview of structural MRI, DTI and MRS imaging biomarkers to monitor disease progression in spinocerebellar ataxia clinical trials.

PET Imaging in Huntington’s Disease Clinical Trials
An overview of the use of PET imaging biomarkers for Huntington’s disease (HD) clinical trials.
MRI Biomarkers in Clinical Trials of Huntington’s Disease
An overview of the use of structural and diffusion MRI imaging biomarkers for Huntington’s disease (HD) clinical trials.
Neuroimaging in Frontotemporal Dementia & Clinical Trials
The utility of MRI & PET imaging biomarkers in our understanding of Frontotemporal Dementia (FTD) variants, and their use as endpoints in FTD clinical trials.
MRI Gadolinium-Enhancing Lesions in MS Clinical Trials
How gadolinium (Gd) enhancing lesions are used to track disease progression & response to therapeutic intervention in multiple sclerosis (MS) clinical trials.
Imaging Biomarkers for Progressive Supranuclear Palsy (PSP)
An overview of the various brain imaging methods (MRI, PET, SPECT) available to assess efficacy of disease-modifying therapeutics in clinical trials of PSP.
Imaging Biomarkers to Distinguish CBD from Other Tauopathies
Overview of brain imaging biomarkers to identify Corticobasal Degeneration (CBD) subjects and their use in clinical trials of disease-modifying therapeutics.
Longitudinal Change in Tau PET in MCI & Alzheimer’s Disease
An overview of the natural history of change in Tau PET tracer uptake & binding in Mild Cognitive Impairment (MCI) & Alzheimer’s disease (AD).