Imaging Biomarkers for Progressive Supranuclear Palsy (PSP)
An overview of the various brain imaging methods (MRI, PET, SPECT) available to assess efficacy of disease-modifying therapeutics in clinical trials of PSP.
Why use neuroimaging in clinical trials of PSP?
Neuroimaging modalities can be used to non-invasively interrogate the structural, functional, and molecular changes that occur in the brains of PSP patients (De Natale, 2023). In clinical trials, brain imaging can serve to improve patient selection, monitor safety, as well as track disease progression and potential treatment effects (Whitwell, 2023).
Multi-modality Imaging Strategy for PSP Clinical Trials
Using neuroimaging in clinical trials involves many important considerations to ensure accurate, reliable, and meaningful results. The choice of imaging modality is crucial, with structural imaging (e.g. MRI) used for detailed neuroanatomy and nuclear medicine imaging (e.g. SPECT, PET) assessing brain activity, metabolic changes, and molecular information. Standardization of imaging protocols and rigorous quality control are essential to maintain consistency across different sites and time points. Neuroimaging aids in patient selection by identifying suitable participants through specific biomarkers, leading to more homogeneous study populations, and enables stratification based on disease stage, severity, and/or biomarker profiles. Monitoring disease progression and treatment effects is facilitated by baseline and follow-up scans, allowing for the tracking of longitudinal changes in brain structure, function, and molecular markers over time. Imaging biomarkers provide early indicators of treatment response, helping assess efficacy before clinical symptoms change. Additionally, neuroimaging enhances safety monitoring by detecting adverse treatment effects on brain structure and function.
Imaging biomarkers used to assess PSP include MRI structural volumetry to assess regional atrophy throughout the brain, especially the midbrain, cortical thickness to assess gray matter atrophy of the cortex, diffusion MRI to assess white matter and structural changes, neuromelanin MRI to assess structural and molecular changes in the midbrain, tau PET to quantify the accumulation of pathological tau species, and DaTscan SPECT or DaT PET to identity changes in dopaminergic terminal density.
Standardization of Neuroimaging Protocols & Procedures
Harmonization of image acquisition and processing/analysis protocols & procedures helps to ensure consistency and reliability across imaging sites and studies. Key aspects must be considered during both the image acquisition and image processing/analysis phases of a research study.
Image Acquisition
Imaging Parameters
- Standardize MRI parameters such as field strength (e.g. 1.5T, 3T), sequence types (e.g. T1-weighted, T2-weighted, diffusion-weighted imaging), slice thickness, and voxel size.
- Standardize the type of radiotracers, the injected dose, and the timing of scans post-injection.
Scanning Procedures
- Ensure consistent patient positioning to avoid variability in image acquisition.
- Standardize pre-scan preparations, such as fasting status for PET scans or the use of contrast agents for MRI.
Site-Training and Certification
- Train and certify personnel at all sites to follow standardized protocols, ensuring consistency in image acquisition and processing.
- Use phantom scans (standardized objects with known properties) to monitor scanner performance regularly. This strategy helps detect and correct any deviations from the expected performance.
Image Processing & Analysis
Quality Control (QC)
- Quality control ensures the integrity and consistency of neuroimaging data throughout the study.
- Employ real-time monitoring of image quality during acquisition to identify and address issues immediately, such as patient motion or other artifacts, and include repeat scans in protocols.
- Use automated & manual QC checks post-acquisition and post-processing to assess source image quality and image processing quality.
Methods of Quantification
- Accurate and reliable quantification of neuroimaging data is critical for meaningful analysis in clinical trials.
- Standardize preprocessing steps, such as motion correction, spatial normalization, and intensity normalization, to ensure data comparability.
- Use validated algorithms for brain tissue segmentation (e.g. gray matter, white matter, CSF) and image registration to a standardized anatomical space.
Test-Retest Reliability
- Conduct test-retest studies to evaluate the reliability of imaging measures. This approach involves scanning the same participants multiple times under the same conditions and assessing the consistency of the results.
Which MRI biomarkers can be used to assess longitudinal change in PSP?
Midbrain atrophy is the classic hallmark of PSP, traditionally identified by the Hummingbird Sign in the superior aspect of the midbrain (Groschel, 2006), the Mickey Mouse appearance (Page, 2020) of the anteroposterior midline diameter of the midbrain at the level of the superior colliculus, and the Morning Glory Sign as a loss of the lateral convex margin of the tegmentum of midbrain (Adachi, 2004). These features can be quantified by assessing the volume changes in subcortical structures, specifically atrophy in the midbrain, pons, and superior cerebellar peduncle (SCP), along with the concurrent enlargement of the ventricles.
Structural brain changes can be quantified using planimetric measurements, such as the midbrain-to-pons ratio or the Magnetic Resonance Parkinsonism Index (MRPI) and the improved MRPI 2.0 (Quattrone, 2018). Longitudinal studies have used changes in MRPI metrics to track changes in the size and shape of the midbrain and to monitor disease progression (Picillo, 2020). Sjostrom et al. extended this work to describe the use of 3D assessments of midbrain volume, which performs better than planimetric measurements in separating PSP from PD patients (Sjostrom, 2020).
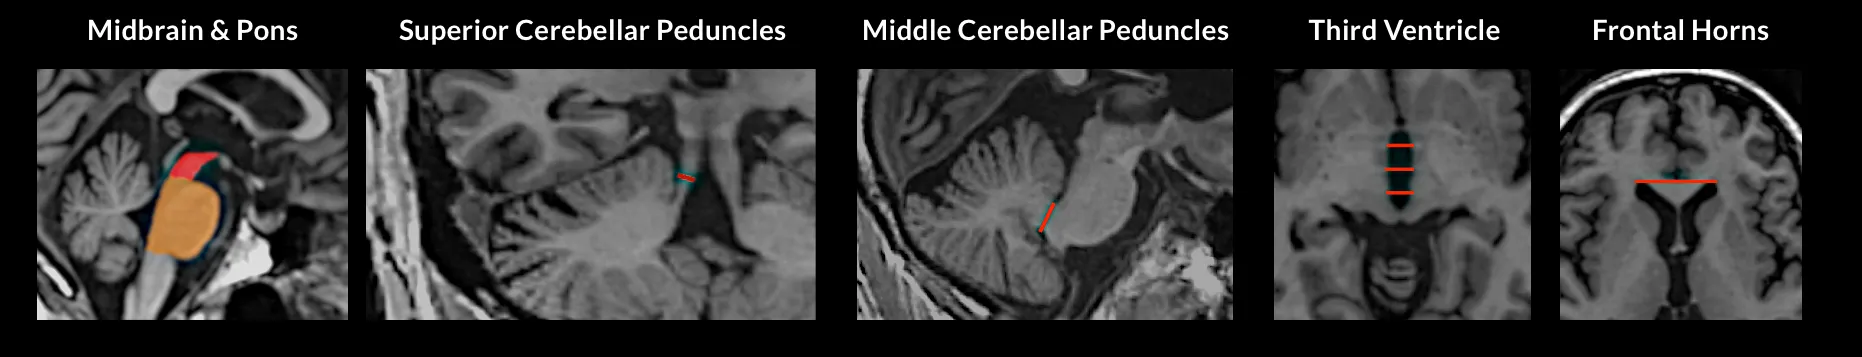
Midbrain atrophy can be quantified by planimetric measurements of the midbrain, specifically the Magnetic Resonance Parkinsonism Index (MRPI). Illustrated on an individual PSP patient, volumes are filled regions and widths are red lines. MRPI = [(P/M) x (MCP/SCP)], where P = area of pons in midsagittal plane (red region), M = area of midbrain in midsagittal plane (brown region), MCP = average width of middle cerebellar peduncles, SCP = average width of superior cerebellar peduncles. The updated MRPI 2.0 = MRPI x (V3 / FH), where V3 = average width (from three measurements) of the third ventricle on an axial image at the level of the anterior and posterior commissures, and FH = maximal left to right frontal horn width on an axial image in the anterior to posterior commissure plane.
Numerous MRI biomarkers have been used extensively to identify and diagnose PSP patients (Oba, 2005), as well as help track disease progression (Picillo, 2020), and may be used longitudinally to evaluate the efficacy of therapeutic interventions (Whitwell, 2017).
Volumetric Changes in Subcortical Structures
Messina et al. (Messina, 2011) and others identified that atrophy of the thalamus occurs only in PSP subjects, while significant hypertrophy was observed in the ventricular system of both PSP and MSA-P subjects (Whitwell, 2007; Messina, 2011; Albrecht, 2019). This observation illustrates the ability of structural volumetry to differentiate PSP subjects from other forms of Parkinsonism. Whitwell et al. also demonstrated that longitudinal midbrain atrophy correlates with progression in the clinical PSP rating score (Whitwell, 2019). Other aspects of clinical progression, such as worse language and fluency test scores, have been correlated with caudate atrophy (Agosta, 2010), and atrophy of the putamen has been shown to be associated with apathy and behavioral disturbances in PSP patients (Josephs, 2008).
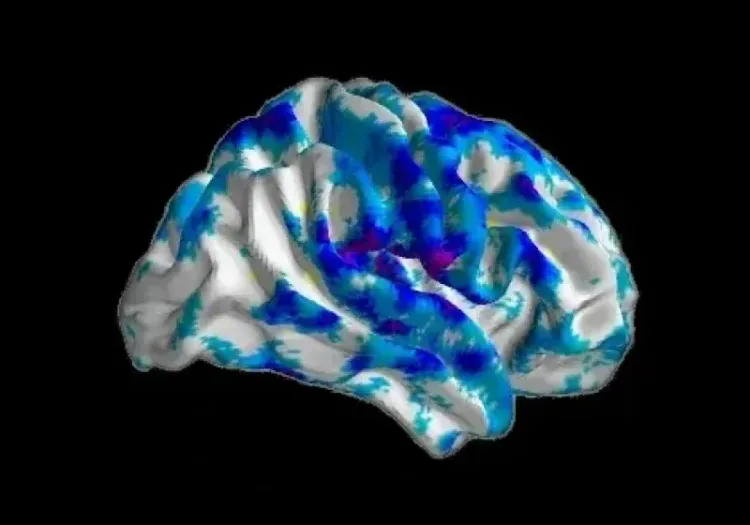
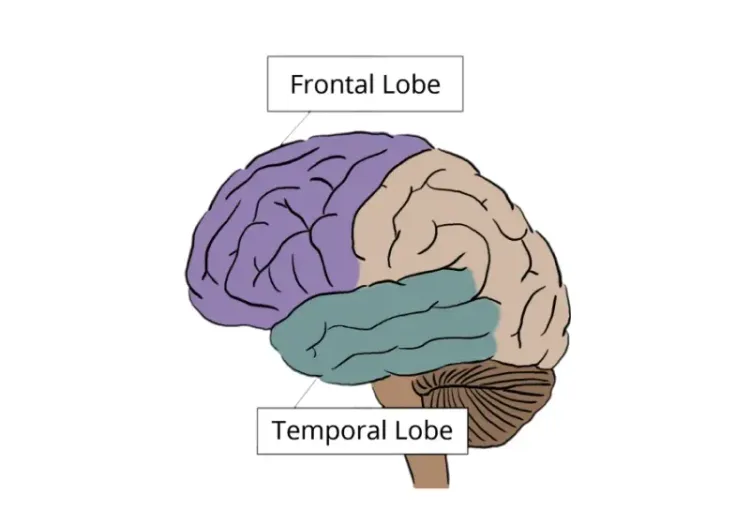
Cortical Thickness
Cortical atrophy, primarily in the frontal and temporal lobes, has been shown to differentiate patients with CBD from PSP (Whitwell, 2007). Whitwell and colleagues have also shown that cortical thickness measurements can distinguish between different forms of PSP, and reliably tracks disease progression over time (Whitwell, 2019). Utilizing voxel-based morphometry (VBM), Agosta et al. provided insights into the specific patterns of cortical and subcortical atrophy associated with PSP, helping to differentiate it from other neurodegenerative disorders (Agosta, 2010).
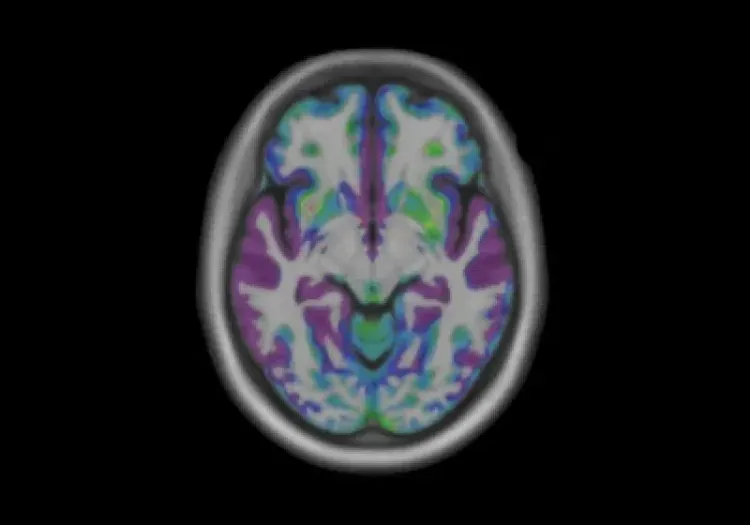
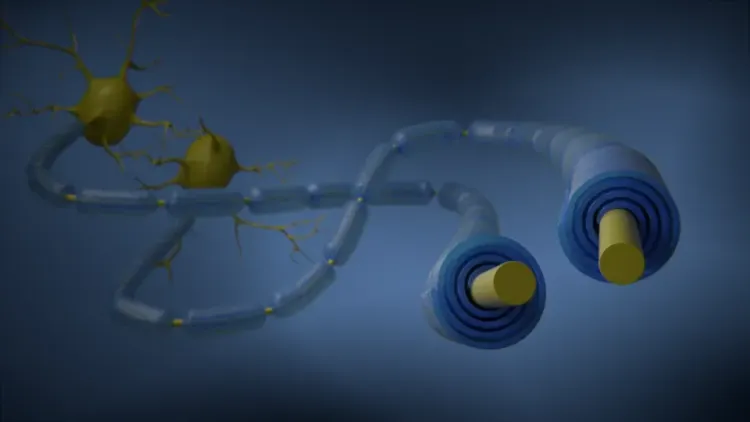
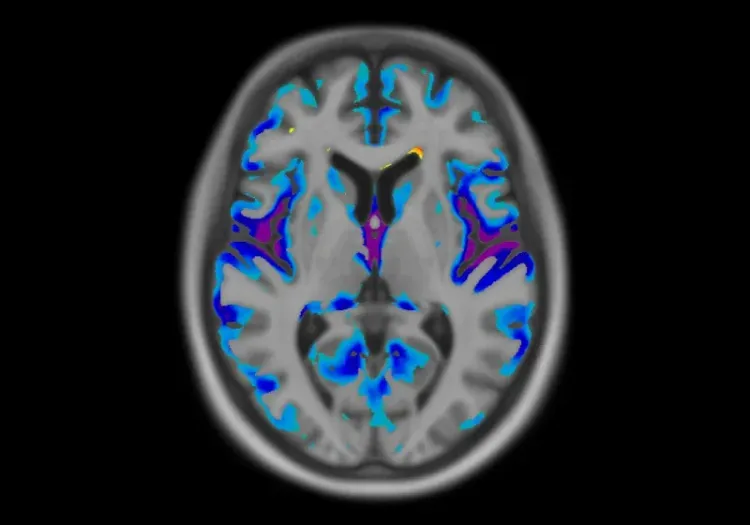
Diffusion (DTI)
DTI can assess microstructural changes in white matter tracts, Agosta et al. showed that WM tract damage influences PSP motor, cognitive, and behavioral symptoms (Agosta, 2014). This study concluded DTI has high sensitivity and specificity for the diagnosis of movement disorders, and can facilitate early diagnosis and differentiating and subcategorizing PSP and other movement disorders.
Neuromelanin & Iron Imaging
Advanced MRI sequences sensitive to neuromelanin and iron deposition, such as susceptibility-weighted imaging (SWI) or quantitative susceptibility mapping (QSM), can track changes in iron accumulation in regions affected by PSP (Mazzucchi, 2019). The neuromelanin-sensitive substantia nigra area and midbrain volume have been shown to be significantly smaller in PSP patients compared with PD patients and controls. Taniguchi et al. have shown diagnostic accuracy was improved when neuromelanin-sensitive MRI analysis was added to volumetric analysis (Taniguchi, 2018). Thus, combining neuromelanin-sensitive MRI and midbrain volumetry may be useful for differentiating PSP from PD.
Which brain PET & SPECT imaging biomarkers have been evaluated for PSP?
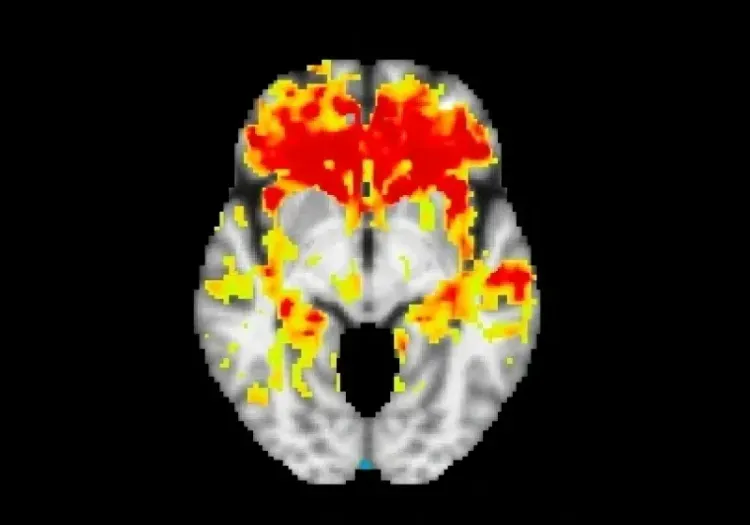
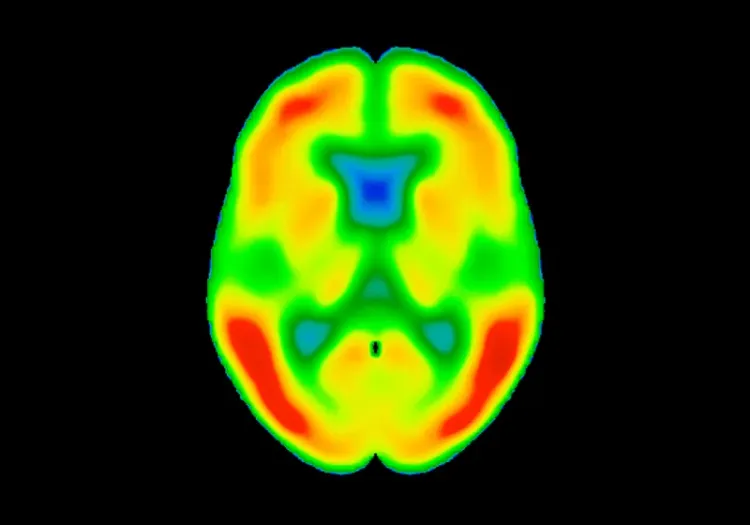
PET imaging biomarkers are extensively utilized to evaluate PSP (Strobel, 2023). Tau PET imaging is particularly relevant for PSP, a 4R tauopathy (Saint-Aubert, 2017; Jin, 2023; Mena, 2023). Tracers such as [11C]PBB3, [18F]THK-5351 (Ishiki, 2017; Harada 2016), and [18F]AV-1451 (flortaucipir) (Mena, 2023) are used to visualize and quantify tau pathology in the brain, specifically in regions such as the globus pallidus, midbrain, and frontal cortex.
Madetko-Alster et al. showed that poor control of glycemia with high glycemic variability correlates with increased atrophy of the medial temporal lobe among patients with PSP and CBS, with concurrent worsening of cognitive performance (Madetko-Alster, 2024). This study identified the importance of glucose metabolism in patients with PSP and CBS. [18F]-2-fluoro-2-deoxyglucose (FDG) PET is used to assess glucose metabolism in the brain. In PSP, significant reductions in glucose metabolism are often observed in the midbrain, frontal, and prefrontal regions (Black, 2024).
[11C]PK11195 is a radiotracer that binds to the translocator protein (TSPO) expressed in activated microglia, allowing for the visualization of neuroinflammation. Studies employing [11C]PK11195 have identified increased binding in the thalamus, putamen, and pallidum when comparing PSP patients with healthy controls, and show significant correlations between the neuroinflammatory marker binding and both cognitive performance and disease severity (Strobel, 2023). There are also indications of a statistically significant correlation between [11C]PK11195 binding and the tau radiotracer [18F]AV-1451 (Strobel, 2023), illustrating the relationship between increased tau accumulation and neuroinflammation.
PSP patients typically exhibit widespread and symmetric reductions in DatScan binding. Recent DatScan analysis comparing PD and atypical parkinsonism (CBD, MSA-P, and PSP) illustrates that DaTscan may assist in differentiating CBD from PSP, although DaTscan does not clearly differentiate among PD, MSA-P, and PSP (Constantinides, 2023).
Our team would be happy to answer any questions about Imaging Biomarkers for Progressive Supranuclear Palsy or provide specific information about our other Imaging services.
Discover more about our Imaging Services
Related Content
Up-to-date information on best practices related to the use of neuroimaging in clinical trials of neurological diseases.
Diffusion MRI & Frontotemporal Dementia (FTD)
Diffusion neuroimaging analysis from the FTLDNI natural history study of Frontotemporal Dementia (FTD).
Frontotemporal Dementia (FTD) & MRI Brain Atrophy
Neuroimaging biomarkers (including MRI brain atrophy) from the FTLDNI natural history study of Frontotemporal Dementia (FTD).
MRI & Corticobasal Degeneration (CBD)
Longitudinal MRI brain atrophy measures from the 4RTNI and FTLDNI studies including sample size calculations for clinical trials of Corticobasal Degeneration.
Neuroimaging in Frontotemporal Dementia & Clinical Trials
The utility of MRI & PET imaging biomarkers in our understanding of Frontotemporal Dementia (FTD) variants, and their use as endpoints in FTD clinical trials.
MRI Gadolinium-Enhancing Lesions in MS Clinical Trials
How gadolinium (Gd) enhancing lesions are used to track disease progression & response to therapeutic intervention in multiple sclerosis (MS) clinical trials.
Imaging Biomarkers to Distinguish CBD from Other Tauopathies
Overview of brain imaging biomarkers to identify Corticobasal Degeneration (CBD) subjects and their use in clinical trials of disease-modifying therapeutics.
Longitudinal Change in Tau PET in MCI & Alzheimer’s Disease
An overview of the natural history of change in Tau PET tracer uptake & binding in Mild Cognitive Impairment (MCI) & Alzheimer’s disease (AD).
MRI in Clinical Trials of Multiple System Atrophy (MSA)
This resource provides an overview of the utility of volumetric MRI and diffusion-weighted imaging (DWI) as biomarkers in research studies of MSA.