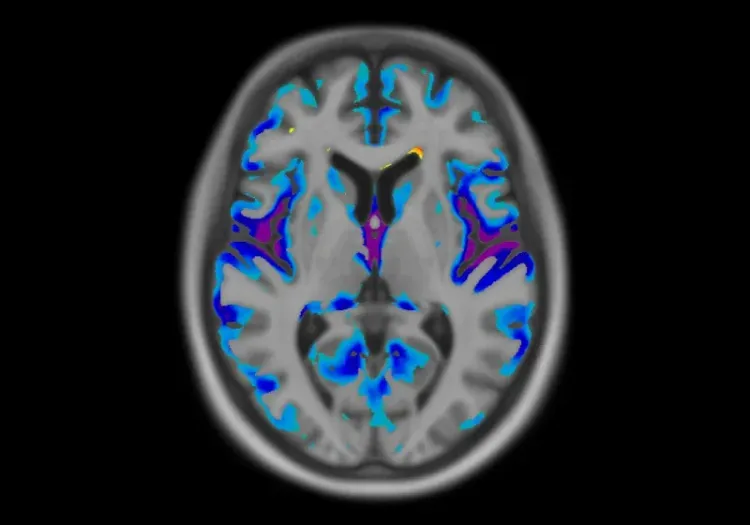
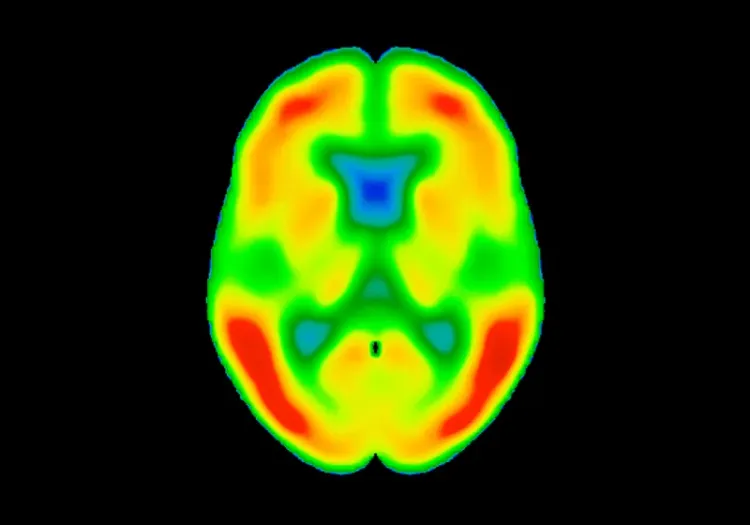
This resource describes:
- What are the different types of lesions that can be evaluated using a Gd-enhanced or T2-weighted scan in MS?
- How does a gadolinium-enhancing lesion evolve over time?
- How are gadolinium enhancements used to monitor treatment efficacy in MS clinical trials?
- What other imaging techniques can be used for monitoring MS progression?
What are the different types of lesions that can be evaluated using a Gd-enhanced or T2-weighted scan in MS?
Early studies on gadolinium enhancement determined that it markedly increases the sensitivity of monthly brain MRI in monitoring the treatment of relapsing-remitting or secondary progressive multiple sclerosis (Miller, 1993; Koudriavtseva, 1997). It improves the contrast of the images by enhancing areas where (1) there is increased blood-brain barrier (BBB) permeability, (2) there is higher permeability of capillaries or local blood vessels caused by immune-mediated inflammation, and (3) there are tissue areas with high protein content or altered tissue matrix due to fibrosis or chronic inflammation indicating recent or ongoing inflammation (Minagar, 2003).
Magnetic resonance imaging (MRI) was formally included in the diagnostic work-up of patients presenting with a clinically isolated syndrome (CIS) suggestive of multiple sclerosis (MS) in 2001 (McDonald, 2001). Although the diagnosis can be made without the presence gadolinium enhancement, it is still the only feature recognized to assess the chronicity of MRI lesions at the time of first evaluation (Thompson, 2018).
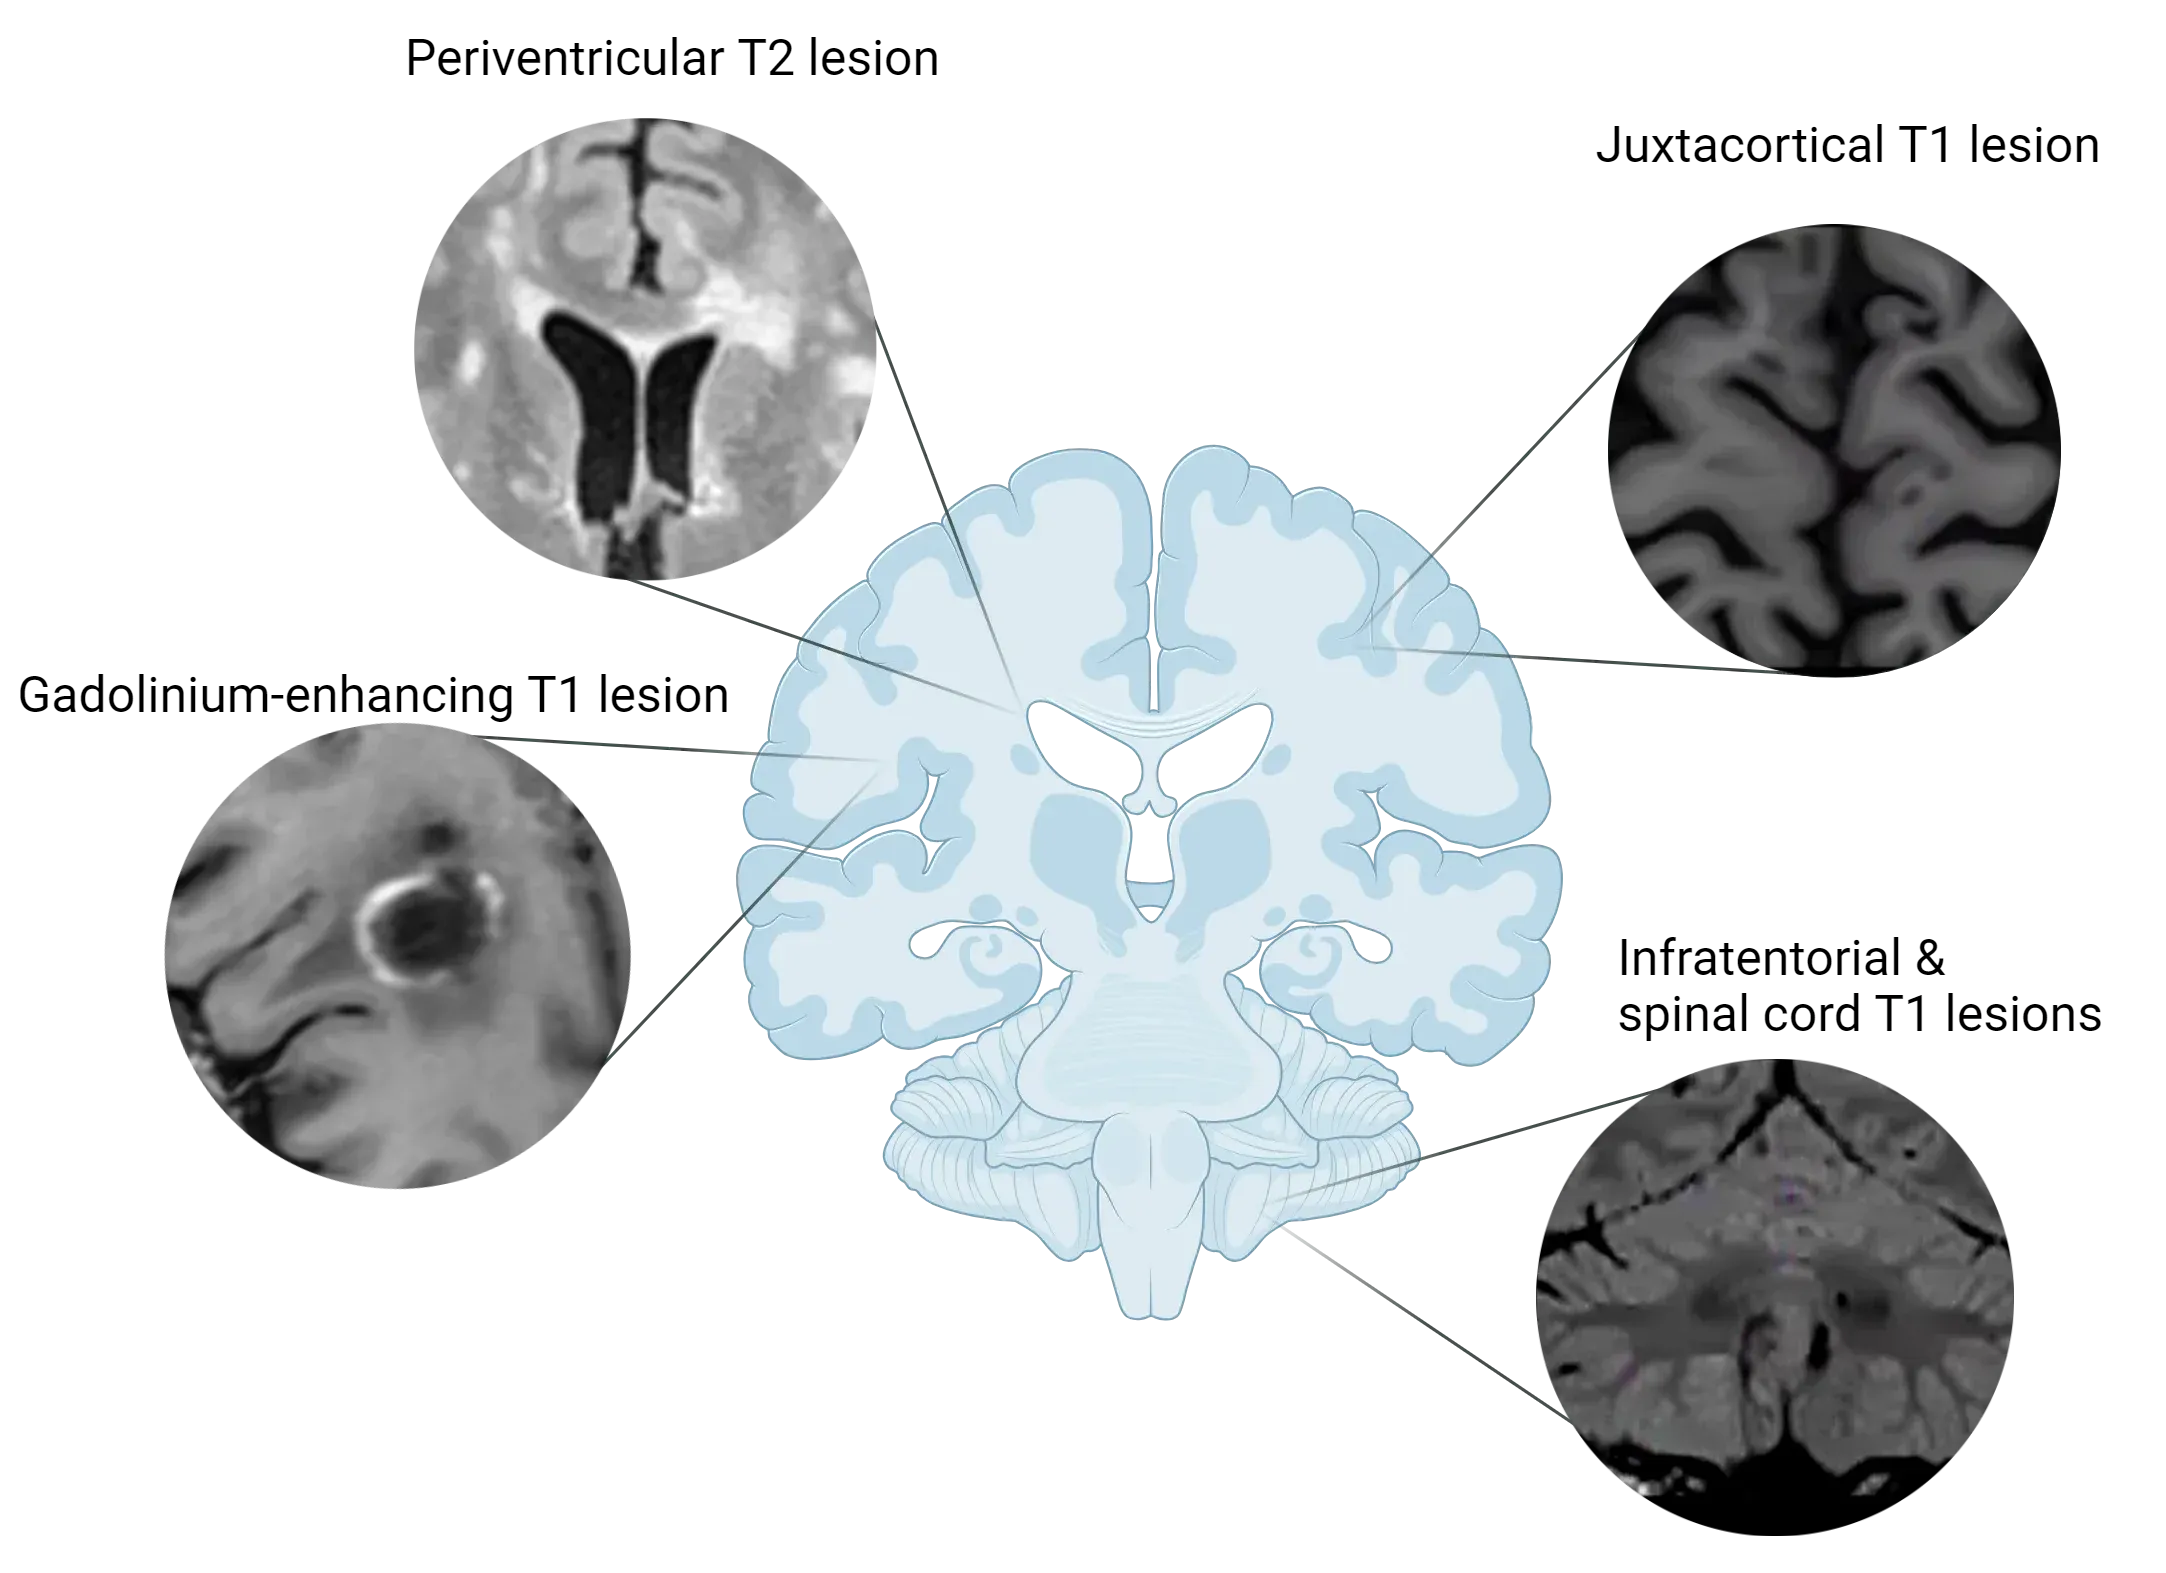
Examples of MS lesions at various locations in the brain.
Homogeneous gadolinium-enhancing lesions are the most frequent type of lesion in patients with MS. Active lesions may show a characteristic ring of enhancement, often indicating newer or ongoing inflammation (Masdeu, 1996). Ring-enhancing lesions show higher levels of tissue destruction than homogeneously enhancing lesions, and thus tend to resolve more slowly and may contribute to more severe clinical disease (Morgen, 2001).
How does a gadolinium-enhancing lesion evolve over time?
Initial Phase (Acute Lesion)
The lesion initially enhances with gadolinium due to acute inflammation. This finding is typically associated with active demyelination and is visible on MRI as a hyperintense lesion on T1-weighted images. This phase is often correlated with a clinical relapse or new neurological symptoms as the inflammatory process can lead to a variety of symptoms depending on the location of the lesion (Thompson, 2018).
Subacute Phase
Within a few weeks (typically 2-6 weeks), the enhancement may diminish or disappear as inflammation decreases and the BBB begins to repair itself. During this phase, the lesion may still be visible as hyperintense on T2-weighted MRI images due to edema and ongoing demyelination, but it will not show enhancement on T1-weighted images (Filippi, 2016).
Chronic Phase
As the inflammatory process resolves, the lesion typically becomes non-enhancing on follow-up MRI. At this stage, it can be classified as a chronic or inactive lesion. The lesion may remain hyperintense on T2-weighted images, but it could appear hypointense (black hole) on T1-weighted images, indicating significant axonal damage and gliosis (glial scar). The presence of T1 black holes suggests irreversible tissue damage (Rocca, 2017). Over time, chronic lesions may stabilize, and their appearance may not change significantly. However, some chronic lesions can reactivate, leading to new inflammation and gadolinium enhancement if there is a resurgence of disease activity (Polman, 2011).
How are gadolinium enhancements used to monitor treatment efficacy in MS clinical trials?
The traditional primary endpoints in Phase 3 MS clinical trials are the Expanded Disability Status Scale (EDSS) and the relapse rate. Secondary endpoint measures in these trials include the number or volume of T2 hyperintense lesions and gadolinium-enhancing T1 lesions on MR images of the brain. The latter are, however, often used as primary endpoints in Phase 2 trials. These measures have been generally accepted as measures of (short-term) treatment effects (van Munster, 2017).

An example of MRI modalities used as imaging endpoints in clinical trials. From left to right: FLAIR, T1-weighted (non-contrast), gadolinium-enhanced T1-weighted, and T2-weighted MR images. Data kindly provided by Lesjak et al. (Lesjak, 2018) and processed by Biospective.
Clinical disease expression and course are highly variable, which hampers defining a uniform concept of disability in MS. The main heterogeneity factors include: (1) wide variation between patients concerning relapse frequency, (2) the extent to which symptoms contribute to overall disability may be more dependent on the location of the lesion rather than on the size or activity, (3) lesions may occur sub-clinically without causing worsening of disability, and (4) since disability often accumulates slowly, long-term follow-up is needed to assess treatment effects (Weinshenker, 1989; Barkhof, 2002).
Nevertheless, white matter pathology has predictive value for the clinical disease course and can explain part of the treatment effect. Patients with MRI evidence of poor response to IFN-β treatment as defined by either ≥2 new hyperintense T2 lesions or new gadolinium-enhancing lesions had significantly increased risk of both future relapses and progression (Dobson, 2013). Treatment effects on new lesions over 1 year mediated a good proportion (70%) of effects on relapses over the subsequent year (Sormani, 2011).
However, due to health concerns for the use of gadolinium-based contrast agents, a recent review by the ESMRMB‑GREC and ESNR Multiple Sclerosis Working Group (Rovira, 2024) concluded that contrast-enhancing and new or enlarging T2 lesions provide redundant information, at least in regular monitoring of the disease. Thus, their use in routine monitoring is not mandatory and must be reduced. Fortunately, the use of non-contrast based imaging technique is showing promising results in monitoring disease progression and treatment effectiveness (Granziera, 2021).
What other imaging techniques can be used for monitoring MS progression?
Several MRI metrics have been showed to correlate better with the neurodegenerative processes of MS than convectional measures (van Munster, 2017). Notably, whole brain and gray matter atrophy correlate strongly with disability and cognitive impairment, both cross-sectionally and longitudinally. A meta-analysis showed that whole brain atrophy in patients that received immunomodulatory treatment was lower compared to the placebo group (Tsivgoulis, 2015).
Another MRI biomarker of neurodegeneration is formation of Persisting Black Holes (PBH), defined as non-enhancing T2 hyperintense lesions (T2HL) with persistant signal intensity between that of the gray matter and the CSF on T1-weighted scans. It is estimated that approximately 30–40% of active T2HL will eventually evolve into PBH within 6–12 months (Van Walderveen, 1998). Some clinical trials found significant treatment effects on the reduction of the formation of PBH (Barkhof, 2001; Filippi, 2001; Dalton, 2004).
T1 relaxometry measures (e.g, T1-RT) are sensitive to myelin, axons, and free water. When applied to black hole quantification, it has been shown to correlate better with composite clinical functional scores compared to total black hole lesion volume (Thaler, 2017), and the decrease over time in T1-RT inside black holes is associated with clinical improvement and response to therapy (Thaler, 2017).
T2 relaxometry measures, such as single-component T2 relaxometry (qT2), Magnetization transfer ratio (MTR), and myelin water fraction (MWF) offer insight into myelin-related, as well as iron content, as validated by postmortem studies (Langkammer, 2010; Laule, 2018). MWF was reported to show more pronounced demyelination in lesions with paramagnetic rims compared with rim-negative lesions (Yao, 2018). MTR changes in normal-appearing white matter (NAWM) preceded the appearance of gadolinium-enhancing lesions in patients with multiple sclerosis, especially in treated patients (Filippi, 1998; Oh, 2019).
Diffusion-weighted imaging (DWI) measures, modeling signal changes associated with the diffusion of water molecules in tissue, are widely available in clinical research and clinical practice, and have been used for many years to assess the CNS tissue integrity in both regions-of-interest and along specific white matter tracts (Song, 2002; Bodini, 2014). Multiple sclerosis MRI studies shows that increases in mean diffusivity (MD) have been reported up to 6 weeks before contrast enhancement (Rocca, 2000; Werring, 2000). MD in enhancing lesions has also been shown to be much lower than in non-enhancing lesions, and to predict the risk of developing persistent black holes (Naismith, 2010; Wang, 2020).
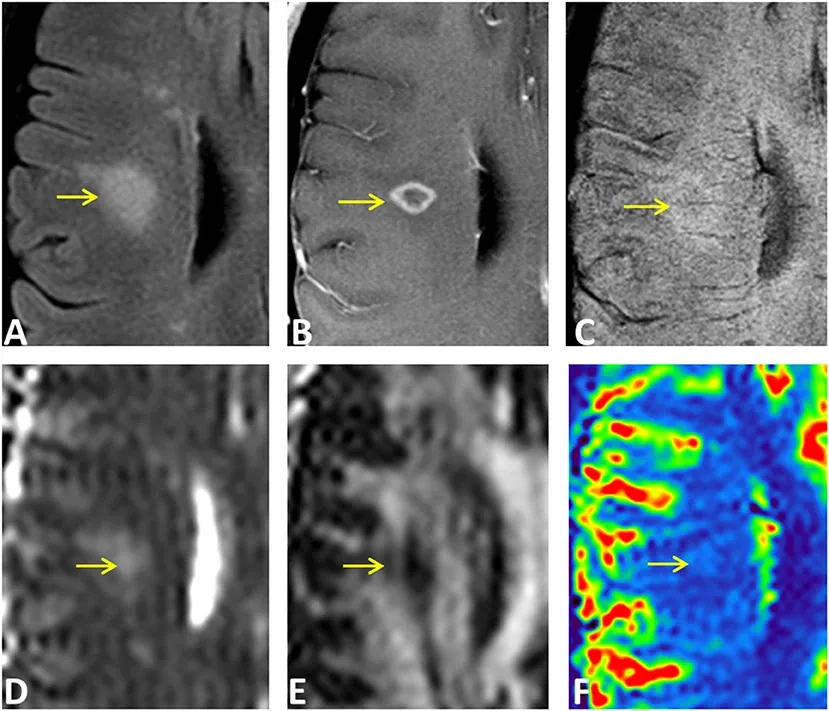
An example of multiple MRI modalities applied to a ring-enhancing lesion in an MS patient. The lesion region is indicated by a yellow arrow in (A) FLAIR, (B) Gd-enhanced T1-weighted MRI, and (C) SWI, as well as on diffusion measures (D) MD, (E) FA, and (F) blood flow parametric maps. Figure reproduced from Sheng et al. (Sheng, 2019) under the Creative Commons Attribution License.
Susceptibility-Weighted Imaging (SWI), and the more computationally intensive Quantitative Susceptibility Mapping (QSM), can quantify paramagnetic trace elements, such as iron in ferritin, deoxygenated-heme in the blood, diamagnetic calcium, and, because of local shifts of the magnetic susceptibility of the diamagnetism of proteins and lipids, it can also quantify myelin and the microstructural anisotropy of white matter (Wiggermann, 2017; Hametner, 2018). In ex vivo brain samples from MS patients, QSM identified iron accumulation in microglia and macrophages surrounding chronic active and smoldering lesions, as well as active myelin digestion during lesion formation (Wisnieff, 2015; Dal-Bianco, 2017). A recent review (Martire, 2022) highlighted that paramagnetic rim lesions (PRLs) are: (1) specific for MS lesions, (2) associated with worse clinical outcomes, and (3) predictive of conversion to relapsing-remitting MS (RRMS) with a high accuracy.
Our team would be happy to answer any questions about MRI Gadolinium-Enhancing Lesions in MS Clinical Trials or provide specific information about our other Imaging services.
Discover more about our Imaging Services
Related Content
Up-to-date information on best practices related to the use of MRI in clinical trials of neurological diseases.
Neuroimaging Biomarkers for Tuberous Sclerosis Complex (TSC)
Overview of brain structural MRI and diffusion-weighted imaging biomarkers to monitor efficacy of disease-modifying therapeutics in clinical trials of TSC.
Neuroimaging in Frontotemporal Dementia & Clinical Trials
The utility of MRI & PET imaging biomarkers in our understanding of Frontotemporal Dementia (FTD) variants, and their use as endpoints in FTD clinical trials.
Imaging Biomarkers for Progressive Supranuclear Palsy (PSP)
An overview of the various brain imaging methods (MRI, PET, SPECT) available to assess efficacy of disease-modifying therapeutics in clinical trials of PSP.
Imaging Biomarkers to Distinguish CBD from Other Tauopathies
Overview of brain imaging biomarkers to identify Corticobasal Degeneration (CBD) subjects and their use in clinical trials of disease-modifying therapeutics.
Longitudinal Change in Tau PET in MCI & Alzheimer’s Disease
An overview of the natural history of change in Tau PET tracer uptake & binding in Mild Cognitive Impairment (MCI) & Alzheimer’s disease (AD).
MRI in Clinical Trials of Multiple System Atrophy (MSA)
This resource provides an overview of the utility of volumetric MRI and diffusion-weighted imaging (DWI) as biomarkers in research studies of MSA.
