Why use neuroimaging in clinical trials of TSC?
Tuberous sclerosis complex (TSC) is a multisystem genetic disorder, characterized by the growth of tumors in the brain, skin, heart, lungs, and kidneys, and caused by loss-of-function mutations in the TSC1 and TSC2 tumour-suppressing genes. It affects up to 2 million people worldwide, with an incidence of 1 case per 6 to 10 thousand births, with up to two-thirds of cases carrying de novo mutations (Henske, 2016).
TSC is a lifelong disease that starts manifesting itself in utero, and involves the central nervous system (CNS) in more than 90-95% of cases (Curatolo, 2015; Russo, 2020). The earliest manifestations are in the central nervous system, with the appearance of subependymal nodules (SEN) and cortical tubers in the fetal brain (Russo, 2020). The subependymal nodules may evolve over time into subpendymal giant cell astrocytomas (SEGA), potentially growing in a life-threatening, obstructive manner in the ventricular system of the brain. White matter lesions are also present, extending from tubers into the subcortical white matter.
Those anatomical changes in turn lead to a large array of TSC-associated neuropsychiatric disorders (TAND), dominated by epilepsy, autism spectrum disorder (ASD), and intellectual disability, as well as attention deficit hyperactivity disorder (ADHD), anxiety and depressive disorders. Epilepsy often begins in the first year of life, and will remain medically refractory (i.e. difficult-to-treat or untreatable) in two-thirds of cases (Henske, 2016), while ASD appears by the age of 5 years (Peters, 2013). Many cognitive aspects of life are affected, starting early on at the behavioral level (aggression, anxiety, hyperactivity, inattention), followed by difficulties at the intellectual and academic levels, and lifelong psychosocial (self-esteem, parental stress, relationship difficulties) and neuropsychological (dual tasking, attentional switching, memory) impairments (Curatolo, 2015).
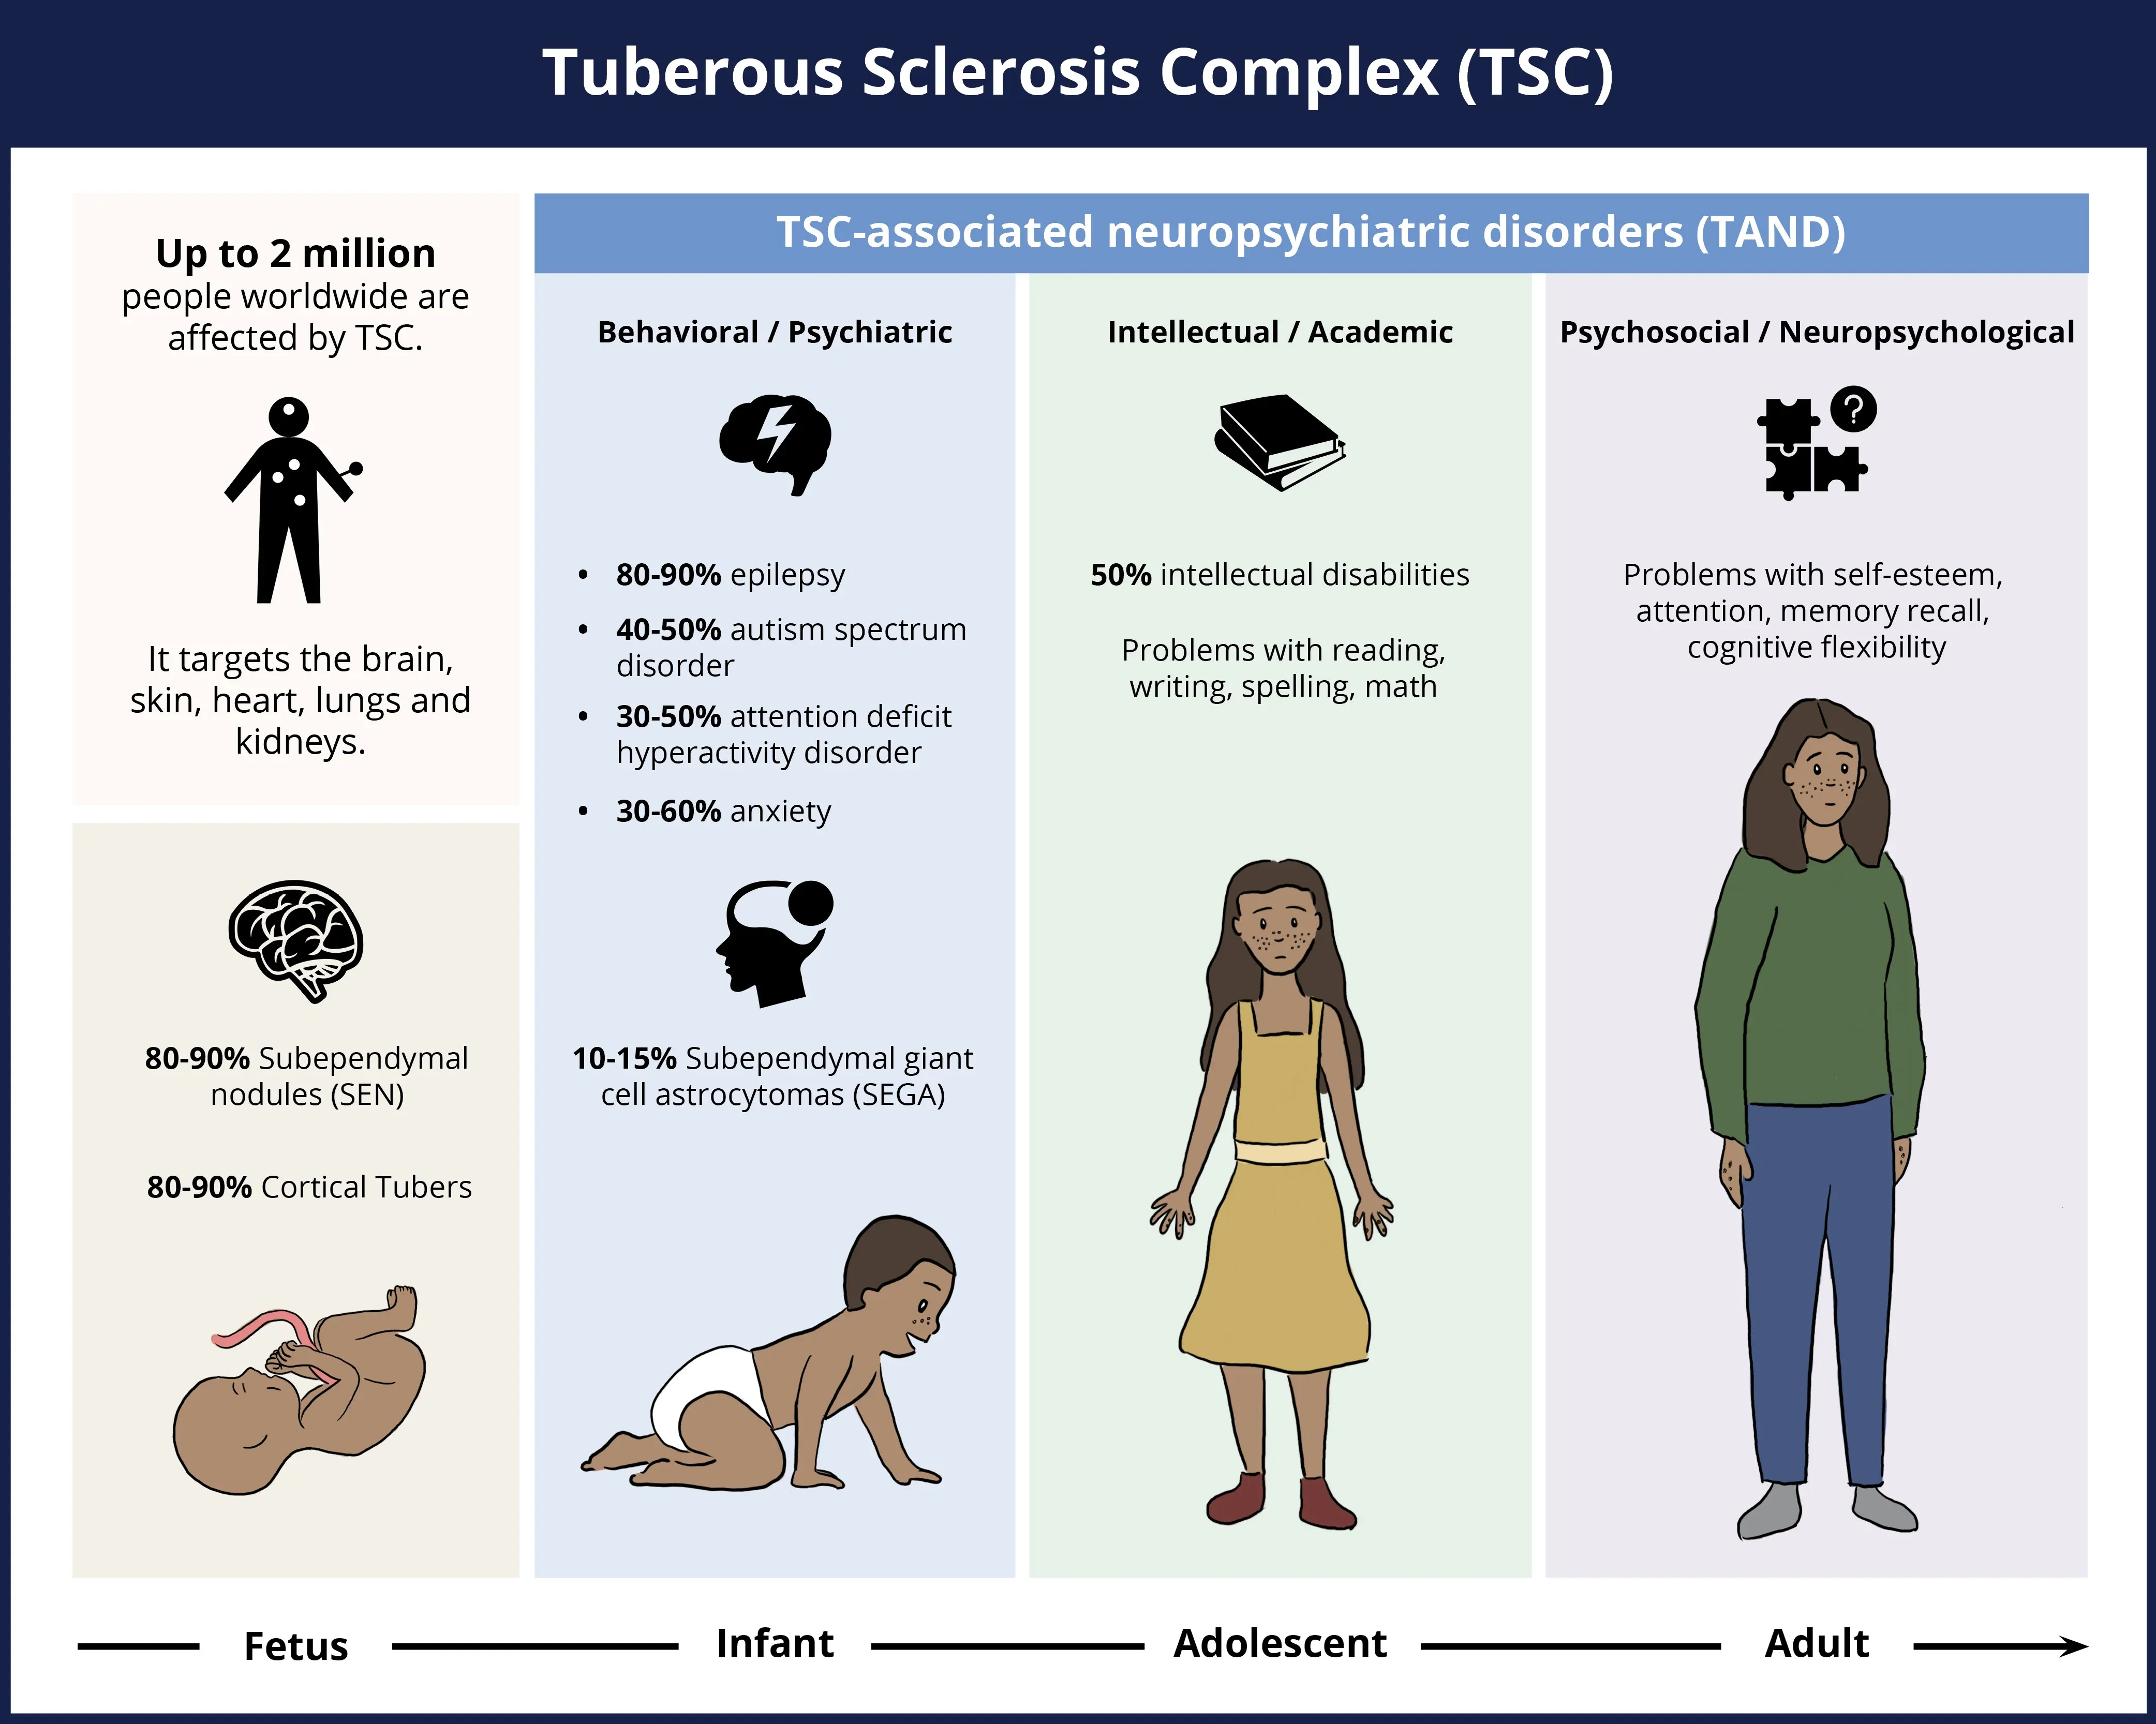
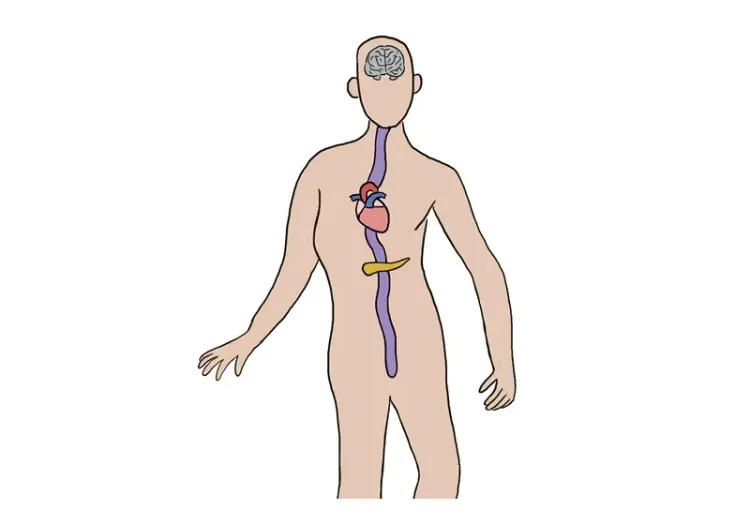
Tuberous sclerosis complex (TSC) is a multisystem disorder that typically presents as early as during fetal development, and continues manifesting itself with substantial neurological disease burden from birth throughout adulthood, though the skin, heart, lungs and kidneys are also affected. The percentage occurrence of various neurological features or symptoms of the disease is indicated in the figure above.
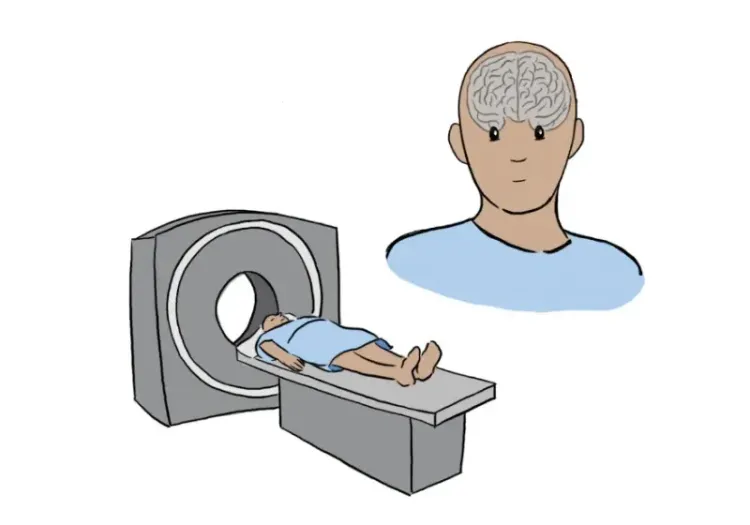
While many organs are affected by the disease, the neurological symptoms are considered the most frequent cause of morbidity and one of the most common causes of mortality (Russo, 2020), and are the focus of this Resource. Neuroimaging, therefore, is considered essential not only for diagnosis, but also for monitoring and management of the disease. In particular, magnetic resonance imaging (MRI) is widely recognized as the reference method to identify and confirm neurological involvement and track changes over time in TSC patients.
Which MRI biomarkers can be used to assess longitudinal change in TSC?
Number and Volume of Cortical Tubers: No
TSC is named after cortical tubers, which were first described as thick and firm gyri upon post-mortem examination (Henske, 2016). They are glioneural non-cancerous masses with a disrupted organization of the 6 layers of the cerebral cortex, sometimes extending from the cortical gyri into the subcortical white matter (Russo, 2020). They are thought to be the primary cause of epilepsy in TSC, and their number and spatial distribution is related to symptom severity. While they can be found anywhere in the cerebral cortex, they are generally present in the frontal and parietal lobes, and may also be infratentorial (Martí-Bonmatí, 2000).
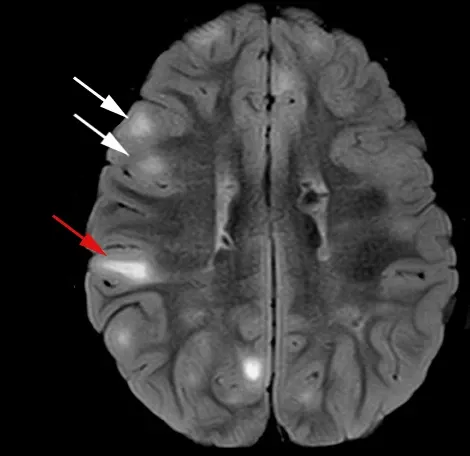
Examples of cortical tubers (white arrows) and radial migration lines (red arrow), as seen on T2-weighted imaging with fluid attenuation (FLAIR). Figure reproduced and modified from Cohen et al. (Cohen, 2021) under the Creative Commons Attribution License.
On MRI, they typically are investigated with T1-weighted (T1W) and T2-weighted imaging (T2W), without or, more commonly, with fluid attenuation (FLAIR). The contrast is dependent on the state of the brain development, and first appears hyperintense on T1W and hypointense on T2W in infants (Russo, 2020). The contrast is then inverted after myelin maturation, and tubers primarily appear hyperintense on T2W, much like white matter lesions observed with age and in neurodegenerative diseases. In all cases, the affected gyri appear thickened and there is a loss of sharp contrast between the gray and white matter that is replaced by a signal intensity gradient.
Many different types of tubers have been described (Gallagher, 2010; El-Beheiry, 2018):
- Type A: hyperintense on T2W and isointense on T1W
- Type B: hyperintense on T2W and hypointense on T1W
- Type C: hyperintense on T2W, hypointense on T1W, heterogeneous on FLAIR with hypointense core signal surrounded by hyperintense rim (“cyst-like”)
- Type D: similar to Type C with blooming on susceptibility-weighted imaging (SWI)
It has been found that as the number and volume of tubers of latter types increases, so does the severity of the disease and of the associated neurological disorders. For instance, larger tubers are generally associated with more epileptic seizures. While described to be stable in size over time beyond fetal development (Russo, 2020), longitudinal studies have observed that half of patients had tubers that changed over time (Vaughn, 2013; Daghistani, 2015). One case study reported that cyst-like lesions specifically (referred above as Type C) may indeed increase in count and size (Chu‐Shore, 2009). It is possible that tubers may appear to be new due to changing contrast or to grow proportional to normal brain development (Russo, 2020). They may also appear to change over time due to calcification (Vaughn, 2013). As there is no widespread evidence that tubers change in count or volume over time (beyond proportional to normal development), or that they may change due to therapeutics (unless new cortical tissue is grown), their number and volume may not be a great biomarker to track longitudinal change, but remain a good imaging biomarker representative of the severity of the neurological manifestations of the disease.
Number of SEN (Subependymal Nodules): No
SEN are benign tissue growths less than 1 cm in diameter that develop in the ependymal lining of the ventricular system of the brain. They are often calcified (Russo, 2020) and, as a result, can be easily detected on computed tomography (CT) and susceptibility-weighted MRI, such as T2*-weighted imaging. They also appear hyperintense on T1W and sometimes on T2W. They tend to be multiple in number, and located generally near the caudate and thalamus, but may also be present near the third and fourth ventricles.
Similar to cortical tubers, the number of SEN is generally stable over time beyond fetal development, exhibiting only changes related to calcification (Curatolo, 2015), and may not be useful as a longitudinal biomarker. However, it is believed they can grow into SEGA, and, therefore, their monitoring is important, as described next.
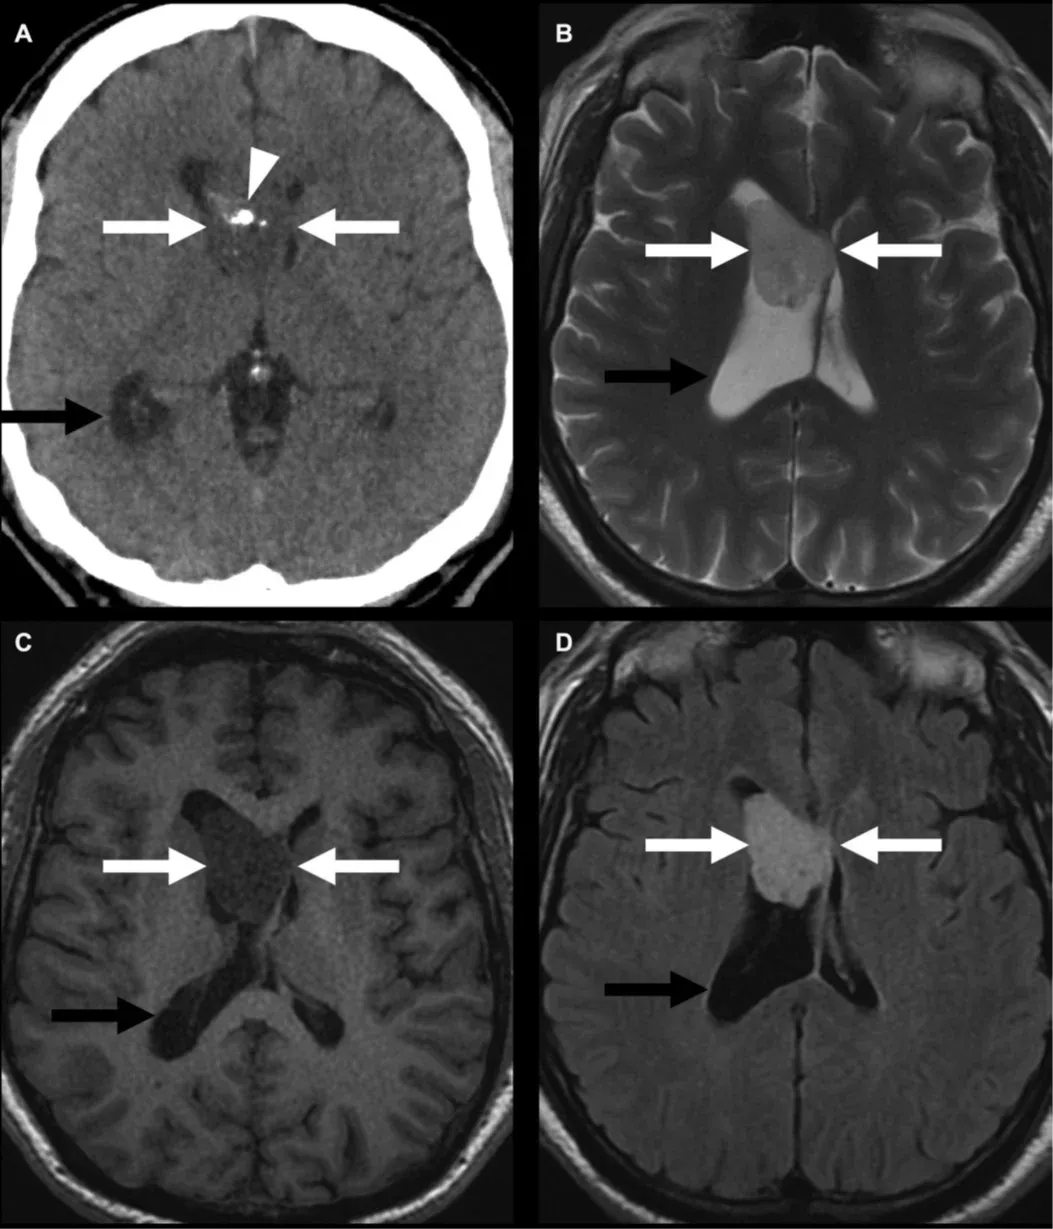
Example of a WHO grade 1 subependymoma (white arrows), similar to subependymal giant cell astrocytomas (SEGA) observed in individuals with TSC, as shown on computed tomography (A) with calcifications (arrowhead), T2W (B), T1W (C) and with post-contrast enhancement (D). If not caught early, they can lead to obstructive hydrocephalus (black arrow) due to blockage of the foramen of Monro. Figure reproduced from Mu et al. (Mu, 2023) under the Creative Commons Attribution License.
Number and Volume of SEGA (Subependymal Giant Cell Astrocytomas): Yes
SEGA are WHO grade 1 benign glioneuronal tumors occurring in 10-15% of individuals with TSC, and generally believed to arise from SEN (Northrup, 2013; Roth, 2013; Henske, 2016). While they are typically slow growing, they can be life-threatening if not monitored, as they can lead to the obstruction of the ventricular system (obstructive hydrocephalus). They are almost exclusively observed at the caudothalamic groove adjacent to the foramen of Monro, and, therefore, SEN present in other locations are typically safe, though atypical SEGA locations have been reported (Russo, 2020). Standard-of-care prescribes routine neuroimaging checks to monitor for the development of a SEGA, typically every 1-3 years until the age of 25 years old, according to 2012 consensus guidelines (Roth, 2013). The cut-off age of 25 years was chosen as new SEGA rarely develop after this age, though existing SEGA may continue to grow, and follow-up scan frequency should be adjusted to how stable existing lesions are.
In terms of appearance on MRI, SEGA are well-defined masses almost entirely contained inside the ventricular system, though exceptions may occur (Roth, 2013). Their T1W and T2W contrast is similar to brain parenchymal tissue, but heterogeneous in appearance (Russo, 2020). They show intense contrast enhancement, though the repeated use of contrast agents is not recommended. Due to the growing nature of SEGA, both their number and volume serve as relevant biomarkers of longitudinal change in TSC.
White Matter Abnormalities: Yes
White matter lesions are observed in nearly all individuals with TSC, from radial migration lines (RMLs) to more subtle and diffuse white matter abnormalities (Curatolo, 2015; Russo, 2020). There has been growing recognition that the previously mentioned macroscopic imaging features do not account for all TAND manifestations, and white matter abnormalities may be related to parts of the neurological symptoms of the disease.
RMLs are visible lines on MRI examination radiating from the periventricular zone into the subcortical white matter, sometimes connecting to cortical tubers or ending abruptly in the white matter, thought to be the consequence of impaired neuronal migration (Russo, 2020). Similar to cortical tubers, they first appear mildly hyperintense on T1W in infants before becoming hyperintense on T2W after myelination. More subtle white matter abnormalities have been investigated with advanced MRI techniques, such as functional MRI (fMRI) and diffusion MRI, hinting at widespread changes in the normal-appearing white matter (Russo, 2020). Those changes progressively develop until the age of 5, co-occurring in time with the onset of neuropsychiatric disorders, and may, therefore, be useful longitudinal biomarkers during this potentially critical intervention window (Peters, 2015). Those white matter changes, best measured with diffusion MRI, are further described in the next section.
Is diffusion-weighted imaging (DWI) useful as a biomarker in TSC studies?
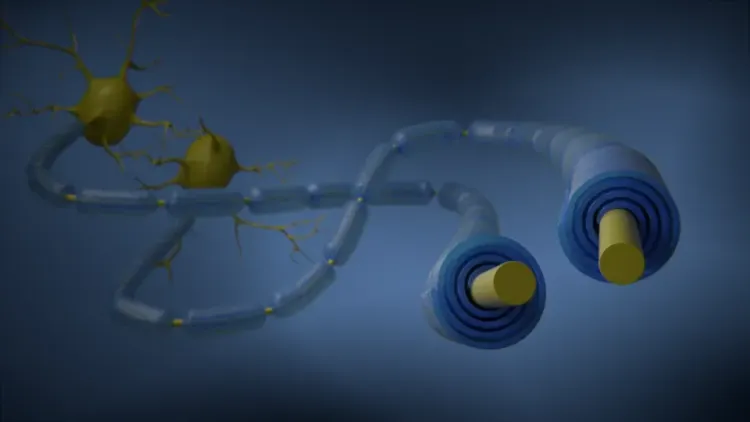
Diffusion-weighted imaging, or diffusion MRI, is often used to investigate alterations in the microstructure of brain parenchyma. It is generally used in white matter as myelin is a lipid and it reduces diffusivity directionally across the myelin sheath, and, therefore, differences and changes in myelination and the integrity of white matter fibers can be captured. While apparent diffusivity coefficient (ADC) maps are commonly used in the clinical setting, the diffusion tensor imaging (DTI) model (Le Bihan, 2001) is generally used in clinical trials and research settings, as it can capture those directional effects well with its fitted metrics, in particular fractional anisotropy (FA), but also axial and radial diffusivity (relative to the direction of highest diffusivity, typically the direction of a white matter fiber bundle). Of note, higher FA typically represents healthier white matter, as it reflects tighter, more myelinated, organized, and coherent white matter, while higher mean diffusivity (MD) generally reflects more leaky, damaged white matter with less coherent boundaries and where astrogliosis may be present. More advanced diffusion MRI models exist, such as the neurite orientation dispersion and density imaging (NODDI) model (Zhang, 2012), but they typically require more advanced acquisition schemes that may be challenging in a multi-center clinical trial.
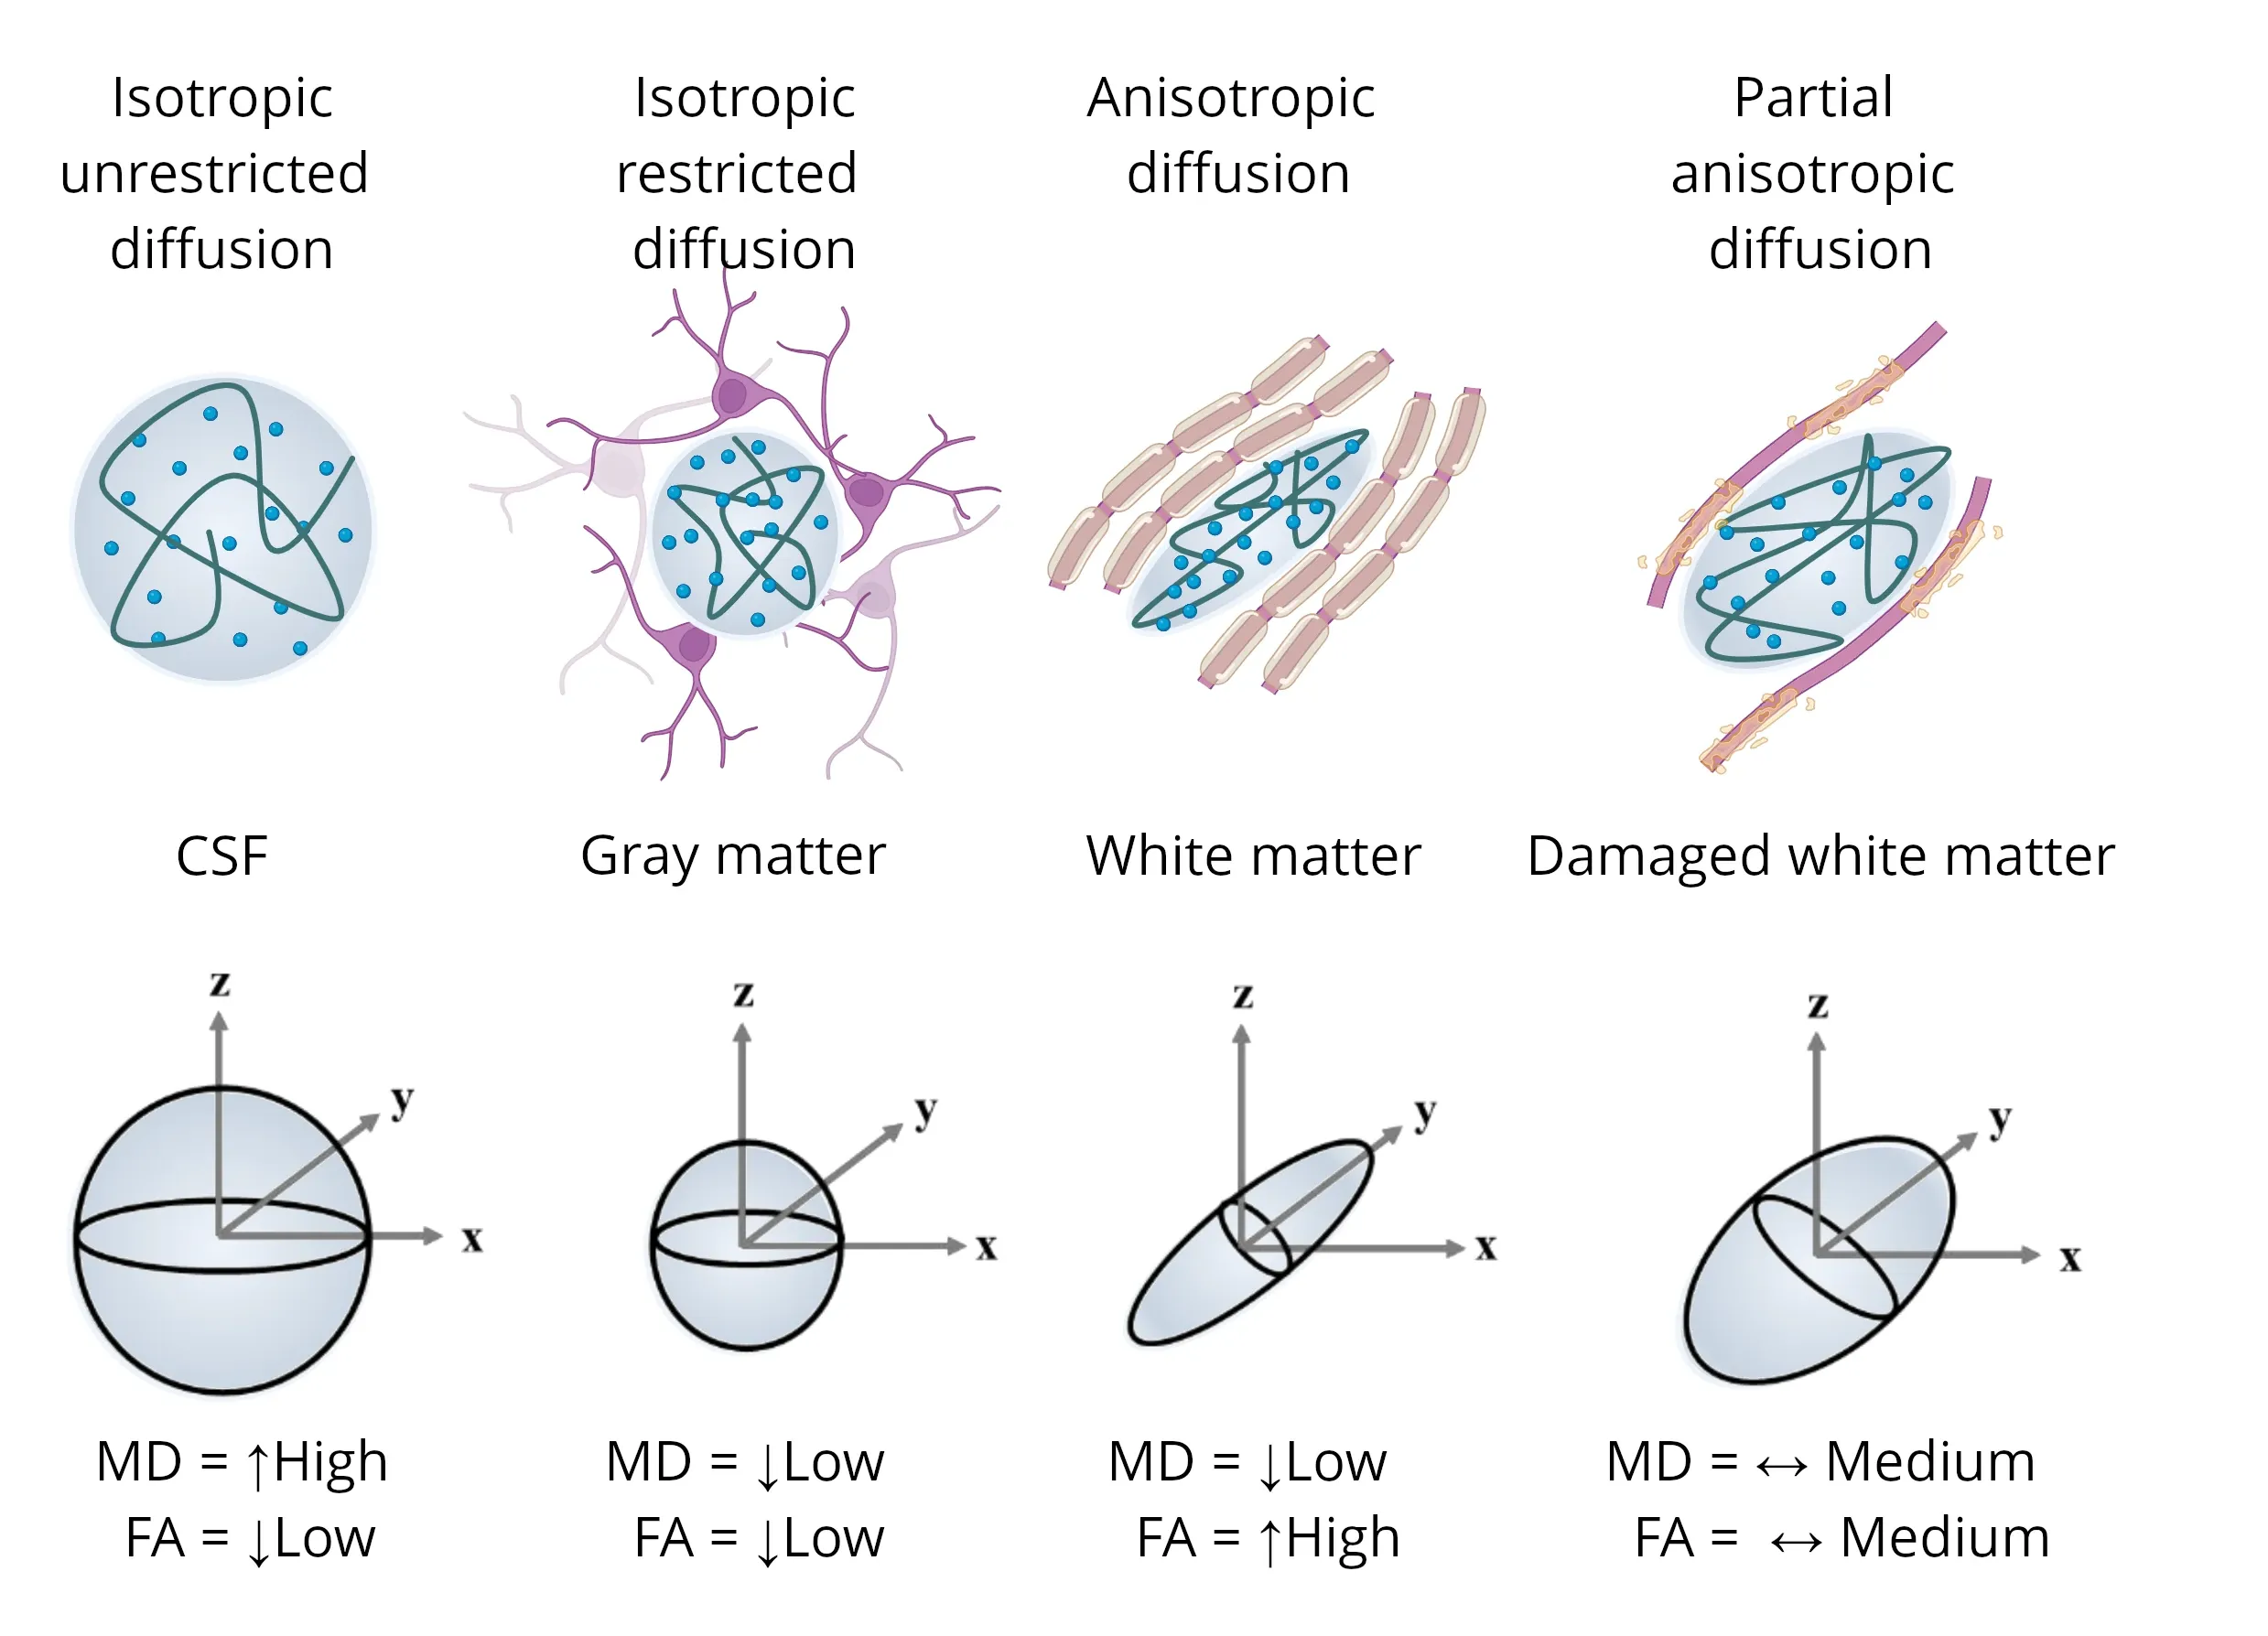
Illustrations of diffusion tensors from various microstructures, highlighting the influence of the anisotropic water component (depicted as the ellipsoid blue dots) on the resulting tensors. Each scenario includes representations of mean diffusivity (MD) and fractional anisotropy (FA). Figure adapted from Colman et al. (Colman, 2022) under the Creative Commons Attribution License.
DTI studies have shown that there is a larger area around cortical tubers that is affected in TSC than can be seen with conventional MRI (Peters, 2013). That perituberal area seems to form a gradient from lowest FA and highest MD inside the tuber to values comparable to white matter in controls in the normal-appearing white matter (NAWM) of individuals with TSC (Peters, 2015). That gradient in DTI metrics in the perituberal area has been shown to correlate well with histopathology of myelin, as assessed with Luxol fast blue (Peters, 2019). The low FA and high MD in the tubers compared to NAWM are consistent with their known disorganized cellular organization and structure, and the differences from NAWM are also increased with tuber type/severity, most prominent in Type C tubers (Gallagher, 2010; El-Beheiry, 2018). All three areas (tuber, perituber, NAWM) show an important increase in FA and decrease in MD up until the age of 5, after which a slower rate of change is observed, similar to maturational changes in the white matter of healthy children (Peters, 2015). The FA and MD of the tuber and perituberal area never reach normal levels, which may represent a potential window for intervention in perituberal areas.
Even if not affected to the level of tubers or perituberal area, abnormalities in DTI metrics have also been found in the NAWM of individuals with TSC. They were also shown to have significantly lower FA and higher mean and radial diffusivity in the corpus callosum and its projections than age-matched controls, with DTI measures also correlating with tuber volume (Makki, 2007; Simao, 2010; Peters, 2012). In particular, individuals with TSC that also had autism spectrum disorder (ASD) showed significantly lower FA than other individuals with TSC (Peters, 2012). A later study showed similar findings, further adding that the co-occurrence of TSC with ASD, intellectual disability, and epilepsy were each associated with lower callosal FA values in a seemingly additive manner (Baumer, 2018). Another study from the TACERN study group found that a reduced longitudinal increase in FA over time in multiple white matter regions of individuals with TSC and ASD compared to individuals with TSC without ASD (Prohl, 2019), though a later longitudinal study from the same group failed to show significant differences (Srivastava, 2024). These studies suggests that DTI may be useful as a biomarker in clinical trials as it correlates with the neurological burden and associated neuropsychiatric disorders appearing during childhood.
DTI metrics were also able to significantly detect longitudinal changes in TSC patients treated with everolimus, an FDA-approved treatment for SEGA and for the adjunctive treatment of refractory seizures (Tillema, 2012). An increased FA and decreased MD was observed after 12-18 months of treatment in the corpus callosum and other regions-of-interest, with no corresponding change in the control group. Similarly, MD was observed to decrease in the corpus callosum of the treated group, while it remained unchanged for the control group in a distinct study (Peters, 2019). Further, greater decrease in MD and increase in FA were observed with longer treatment, especially in the younger subgroup (under 10 years of age), much like what was observed for the reduction of seizure frequency in a distinct trial (Franz, 2021). As higher MD and lower FA is observed in epileptogenic tubers than other tubers (Peters, 2013), and improvements in both DTI metrics and seizure frequency were observed with the same treatment, especially with longer duration and at younger age, this data provides evidence for DTI metrics to be a useful longitudinal imaging biomarker, especially for early intervention, and that they may respond to treatment in a clinical trial.
Our team would be happy to answer any questions about Neuroimaging Biomarkers for Tuberous Sclerosis Complex or provide specific information about our other Imaging services.
Discover more about our Imaging Services
Related Content
Up-to-date information on best practices related to the use of neuroimaging in clinical trials of neurological diseases.
PET Imaging in Huntington’s Disease Clinical Trials
An overview of the use of PET imaging biomarkers for Huntington’s disease (HD) clinical trials.
MRI Gadolinium-Enhancing Lesions in MS Clinical Trials
How gadolinium (Gd) enhancing lesions are used to track disease progression & response to therapeutic intervention in multiple sclerosis (MS) clinical trials.
Imaging Biomarkers for Friedreich’s Ataxia Clinical Trials
An overview of the use of MRI and DTI imaging biomarkers for Friedreich’s ataxia (FRDA) in research studies & multi-center clinical trials.
Frontotemporal Dementia (FTD) & MRI Brain Atrophy
Neuroimaging biomarkers (including MRI brain atrophy) from the FTLDNI natural history study of Frontotemporal Dementia (FTD).
