Muscle MRI Biomarkers for Duchenne Muscular Dystrophy (DMD)
An overview of the use of MR imaging biomarkers for Duchenne Muscular Dystrophy (DMD) in research studies & clinical trials.
What are the genetic causes and clinical features of DMD?
Duchenne Muscular Dystrophy (DMD) is a rare, X-linked recessive neuromuscular disease characterized by progressive weakness of muscle, with an incidence of approximately 1:3500 to 1:5000 live male births (Hoffman, 1987; Duan, 2021). The DMD gene, the largest known human gene, exhibits a high mutation rate and varying mutation locus, with de novo mutations constituting approximately 1:3 cases of DMD (Muntoni, 2003). Mutations in the DMD gene, most commonly frameshift or nonsense mutations, result in absent, unstable, or significantly reduced dystrophin, a key structural protein complex essential for maintaining muscle integrity and dynamism (Blake, 2002). Truncated dystrophin lacks the domain to connect the actin cytoskeleton and connective tissue, resulting in a non-functional or unstable protein. Mechanical stress on the muscle leads to cumulative and chronic muscle damage, inflammation, and infiltration of fat and fibrotic tissue into skeletal muscle fibres (Koenig, 1988; Muntoni, 2003). Furthermore, repeated cycles of degeneration and regeneration, from an early age, deplete the pool of regenerative satellite cells diminishing regenerative capacity over time (Molinaro, 2024). The atrophy of muscle, combined with the decreased regenerative potential of this disease, contributes to the progression of DMD.
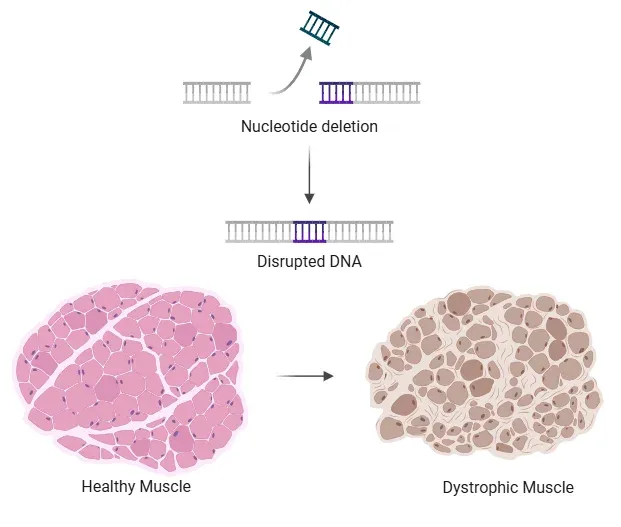
Schematic showing healthy muscle vs loss of muscle integrity in DMD due to deletion of a nucleotide in the DMD gene, resulting in a disrupted reading frame and absence of functional dystrophin.
The first clinical signs of DMD begin to emerge between 2-3 years-of-age, characterized by delayed walking, difficulty climbing stairs, a Gowers’ sign, or walking in a Duchenne gait pattern (Bushby, 2010). At this early symptomatic stage, specific biomarkers can indicate muscle damage and inflammation, such as elevated creatine kinase (CK) levels in the blood. As mobility increases, without adequate dystrophin and damage repair mechanisms, gross motor muscles become increasingly stressed, inflamed, and damaged.
By the mid-stage of DMD (typically around 7-12 years-of-age), there is significant atrophy of various muscle groups, fat infiltration, and fibrosis in the extremities (Mendell, 2012). Pseudohypertrophy in the calves is a result of healthy muscle tissue being replaced by fat and connective tissues (Davis, 1982). At this stage, ambulatory function progressively declines.
By approximately 12 years-of-age, most individuals with DMD have a loss of ambulation and progressively less mobility in their arms due to a considerable proportion of muscle replaced by fat. Muscles become progressively more damaged with time, including organs such as the heart and lungs. In late-stage DMD (usually late adolescence/ the early 20’s), there is typically a full loss of ambulation in the legs, upper body, and as well as significant respiratory and/or cardiac dysfunction, which leads to mortality (Van Ruiten, 2017).
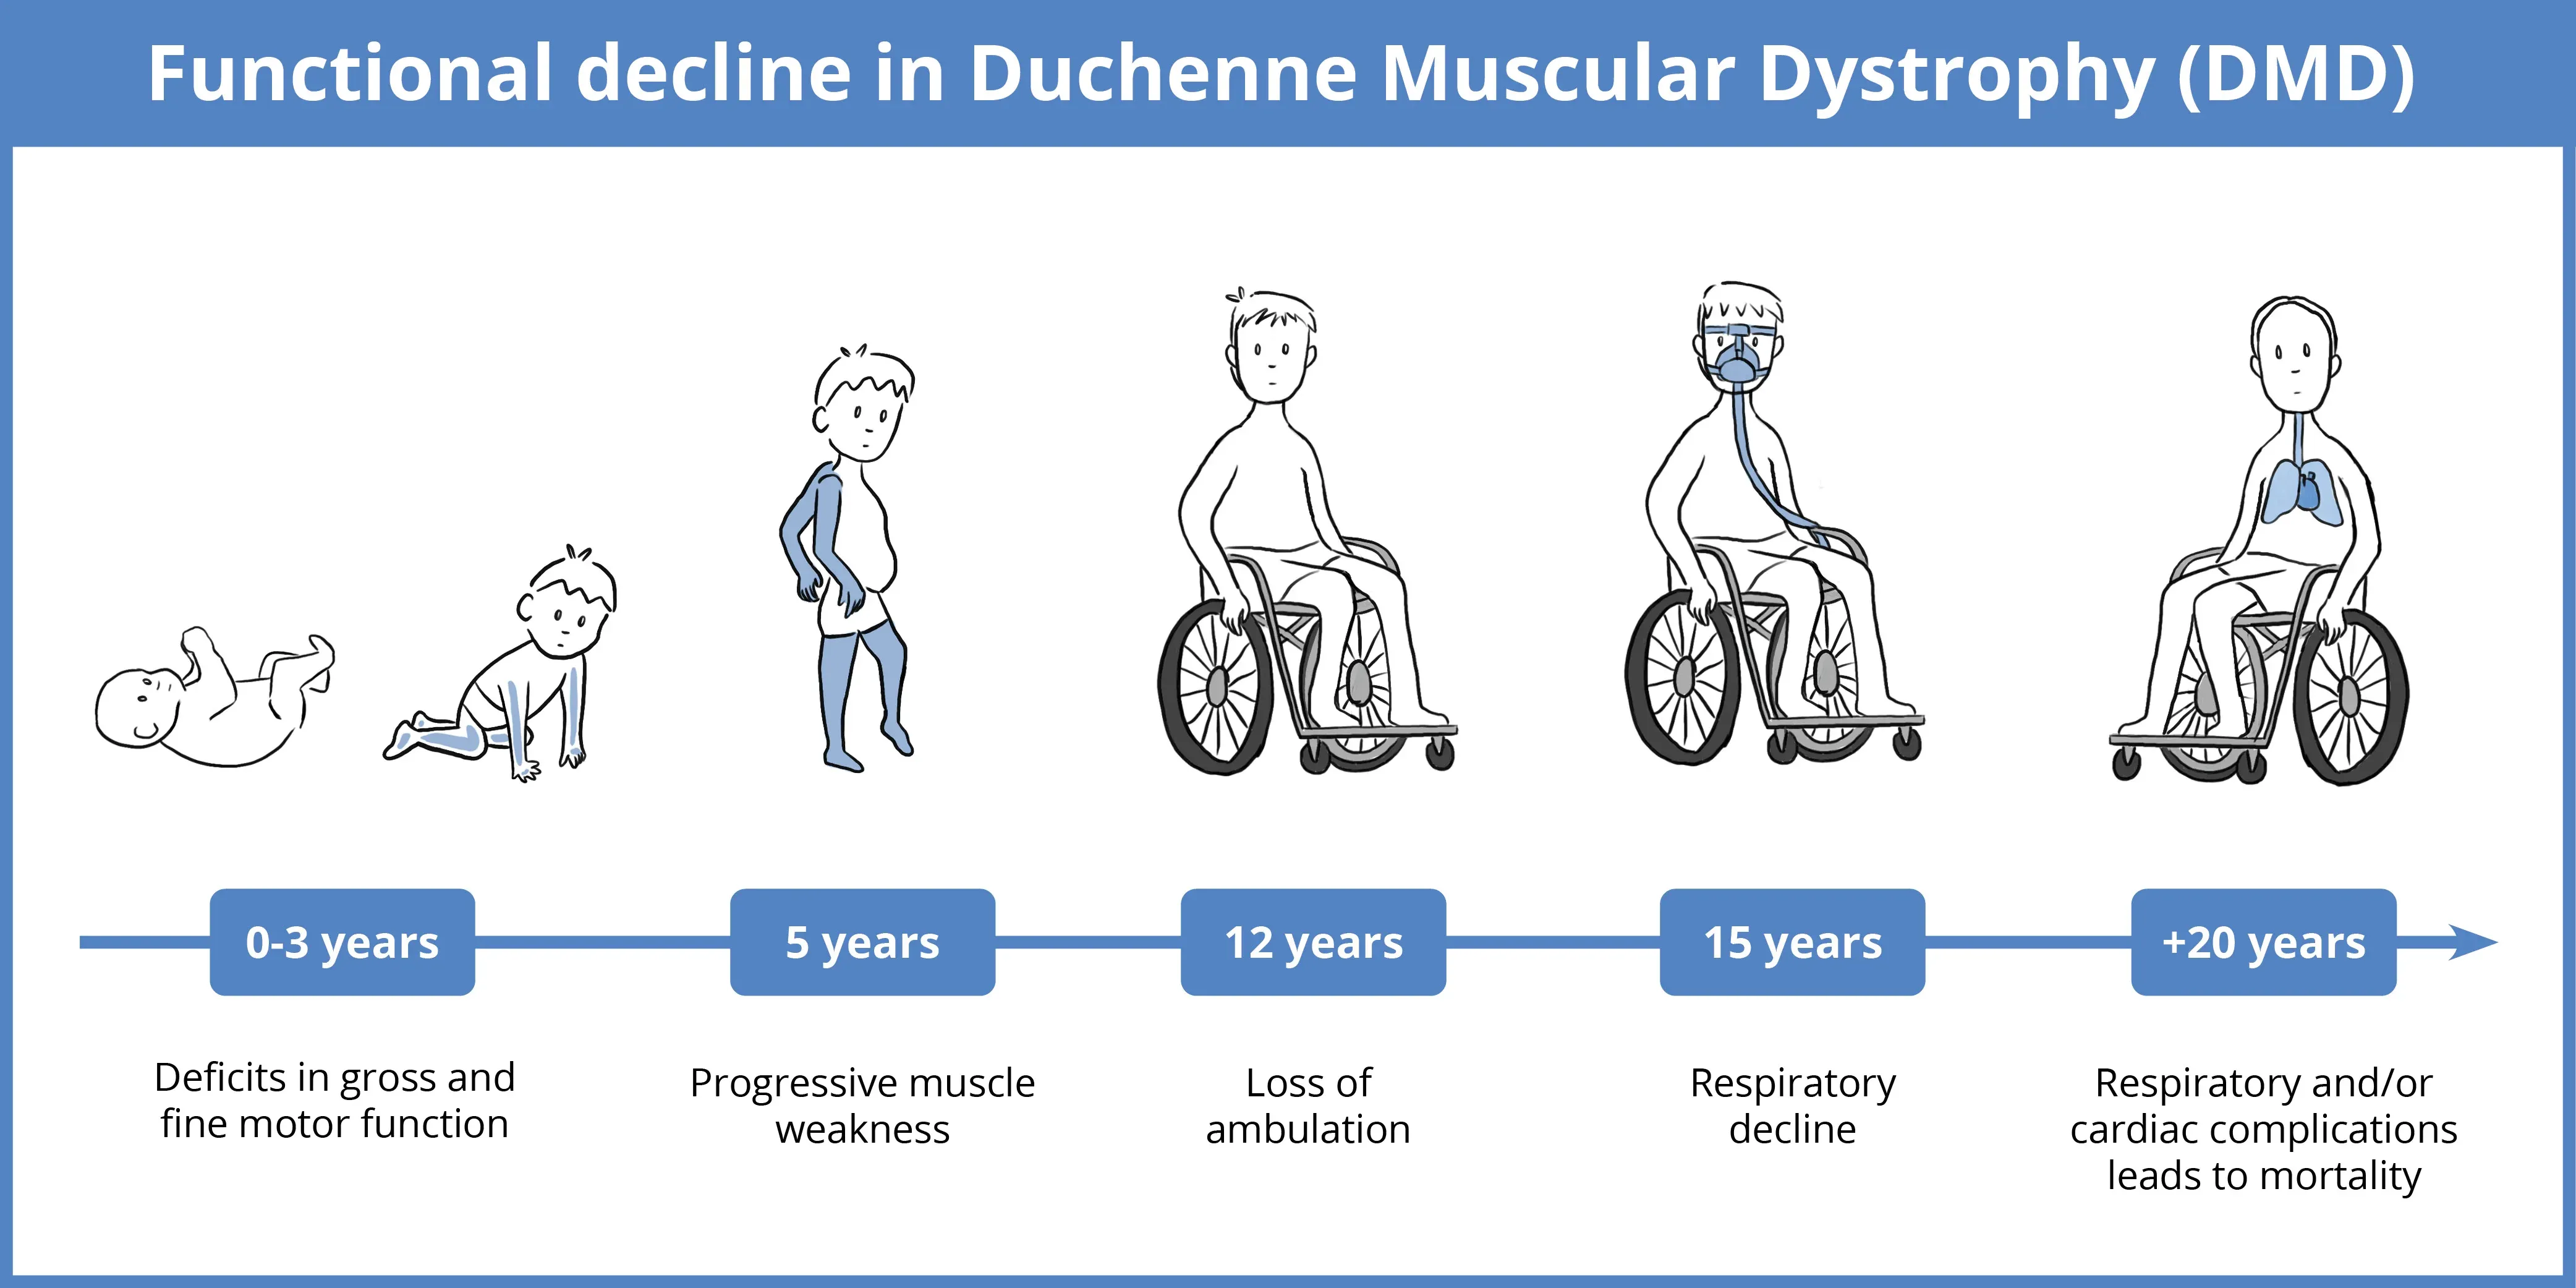
Schematic of clinical progression of DMD, including age range, body areas affected, and disease stages.
The trajectory of DMD symptoms and outcomes does not follow a stereotypical pattern. Factors that influence progression include age, initial ambulatory function, muscle load, stress, and tissue fiber composition (Benemei, 2024). Interventions, such as treatment, have also been effective in delaying loss of ambulation. Multi-disciplinary treatment approaches and monitoring have been effective in prolonging the lives of individuals with DMD. Emerging evidence supports the use of biomarkers and muscle composition measures, with magnetic resonance imaging (MRI) as an effective tool in informing disease progression, responses to treatments, and predicting clinical outcomes for patients (Sherlock, 2021; Landfeldt, 2024).
Which MR imaging techniques are effective for monitoring biomarkers in DMD progression?
Muscle magnetic resonance imaging (mMRI) is a well-established, non-invasive tool for monitoring and quantifying morphological changes and disease progression in DMD. Numerous studies have demonstrated correlations between various MRI modalities, functional motor assessments, and clinical outcomes (Ropars, 2020). However, the heterogeneity of disease progression and inter-individual variability present challenges in standardizing imaging protocols. Currently, progressive morphological changes in the muscle require stage-specific imaging techniques to assess biomarkers of disease progression. To address these challenges, various MRI modalities, including T1-weighted, quantitative T2 imaging, Dixon MRI, magnetic resonance spectroscopy (MRS), and cardiac MRI can be utilized to assess distinct aspects of DMD.
T1-weighted MRI
T1-weighted (T1w) MRI is a qualitative or semi-quantitative technique to assess the muscle composition in DMD (Senesac, 2020). T1-weighted imaging has excellent anatomical contrast and provides valuable feedback on structural information. T1w images allow for distinction of different tissue types by contrast; on a T1w image healthy muscle appears dark, while fat has a hyperintense signal within the muscle. Therefore, fat infiltration and chronic fatty replacement is easy to see visually. T1w images can be used to assess disease progression with semi-quantitative grading to estimate the extent of fat infiltration within the muscle without the requirement of image processing, making it accessible to use in monitoring, research, and clinical trials directly at the imaging site (Mercuri, 2002) Recently, quantitative and more sensitive MR modalities, such as T2 MRI, MRS, and Dixon MRI, have been used to provide quantitative outputs that may offer additional insights into pathophysiology and responses to treatment.
Quantitative T2 MRI
T2 imaging is a quantitative MRI technique that measures the transverse relaxation time (T2), which is sensitive to many pathophysiological changes happening in DMD. It is especially sensitive to increases in water content, such as with edema and inflammation, and can be used to monitor these biological changes early in disease prior to fat infiltration. T2 imaging is additionally sensitive to fat replacement, necrosis and fibrosis in later disease stages, which continue to make it useful as a composite disease-burden biomarker, but one that is less specific to a particular disease process.
T2 imaging has demonstrated the potential to monitor and quantify muscle pathophysiology in a wide spectrum of boys with early-stage and mid-stage DMD. Studies comparing boys with early DMD, older boys with DMD, and boys without DMD found elevated T2 values in boys with DMD compared to age-grouped controls in leg muscles. T2 values were further increased in older boys with DMD compared to younger boys with DMD (Arpan, 2013). Willcocks et al. (Willcocks, 2014) supported these results in a longitudinal study conducted over 2 years, which found that mean T2 values and the percentage of elevated voxels significantly increased at the 1-and 2-year timepoints in the soleus muscle. Notably, soleus T2 values increased during the study with each age group, but more rapidly in boys ages 9-13 than in younger age groupings and correlated with established functional assessments. These findings suggest that quantitative T2 imaging can be analyzed for clinical outcome measures in a wide variety of ages, particularly before and during fat accumulation in the leg muscles (Willcocks, 2014). However, once muscles become saturated with fat, MR sequences, such as MRS and Dixon MRI, become more relevant for sensitive quantification, especially in smaller muscle areas.
Magnetic Resonance Spectroscopy
Magnetic Resonance Spectroscopy (MRS) allows for the non-invasive explorations of the molecular composition of tissue by analyzing the chemical shift during MR imaging. The value of the chemical shift provides information about the molecular structure in a tissue and metabolic changes over time. In particular, this allows quantification of fat fraction, by comparing the lipid signal relative to the water signal. MRS is well-established, highly sensitive technique used to study a myriad of diseases and is sensitive to minor changes in tissue and can be used to track longitudinal change in DMD and responses to therapies (Willcocks, 2016; Barnard, 2020).
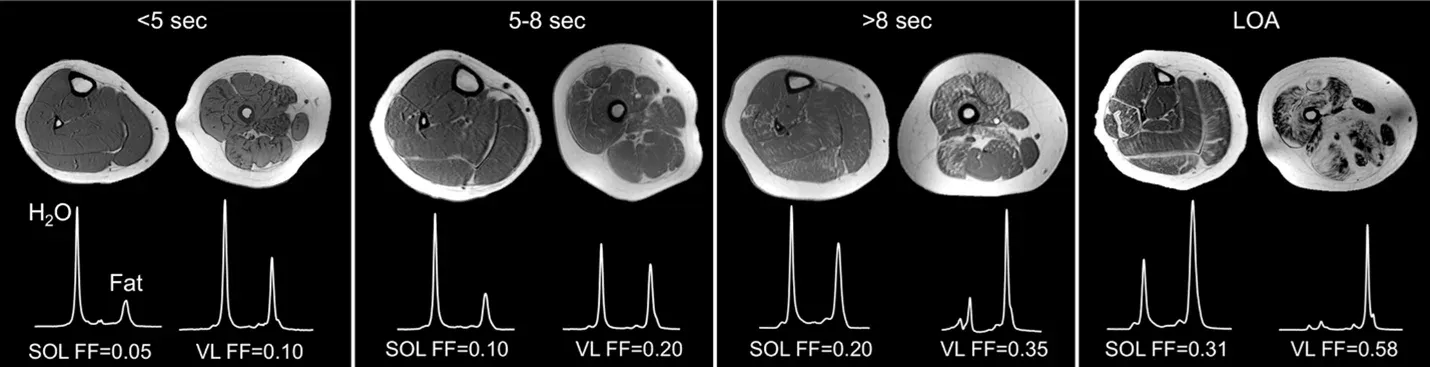
Examples of T1w images with MRS quantifications of the calf and thigh of participants with increasing amounts of fat infiltration (left to right) in soleus (SOL) and vastus lateralis (VL), which results in decreased ambulatory ability. 10-meter walk/run times are denoted above. Image adapted from (Barnard, 2018) under the Creative Commons Attribution License.
A longitudinal analysis of lower extremity muscles in 160 participants supported the link between MRI T2 mapping, fat fraction (FF) by Magnetic Resonance Spectroscopy (MRS), and ambulatory functional assessments up to 48 months (Barnard, 2020). In this study, the magnitude of the 12-month change from baseline fat fraction values in the vastus lateralis was predictive of improvement in function over the next 12 months. Individuals with negligible or small changes (change ≤0.02) remained stable or improved functional performance. Nealy 90% of individuals that increased in fat fraction (>0.15) declined in or lost function.
In addition to fat fraction, MRS measures of creatine phosphokinase (CPK)/phosphocreatine (PCr)/creatine (Cr) can reflect the metabolic changes within the muscle, associated with poor muscle function (Wyss, 1998; Wyss, 2000). The effects of supplementation with Cr in patients with DMD showed an increased ratio in PCr/ inorganic phosphorus, measured by phosphorus MRS (31P-MRS), indicating improved muscle energy metabolism (Banerjee, 2010). While the long-term effects of this approach are unknown, this study shows that 31P-MRS can be a valuable tool in monitoring the changes in metabolic biomarkers of muscle energy metabolism in DMD.
Dixon MRI
Dixon MRI (or chemical shift imaging) is a quantitative technique that uses several MRI images collected at different echo times to separate water and fat signals, enabling the precise measurement of fat infiltration. While Dixon MRI fat fraction results have correlated well with previously mentioned MR methods, its sensitivity sets it apart from other modalities. Compared to T2 mapping, Dixon MRI quantifies the fat replacement of muscle as the disease progresses directly and is less sensitive to changes in water content. Additionally, MRS provides metabolic measures only in a localized region of the muscle and may not capture the broader muscle infiltration or infiltration in muscle groups (Willcocks, 2016). Fat fraction measured using Dixon MRI correlates well with FF using MRS, but Dixon is also useful in allowing comparison between muscle groups in the proximal upper extremity due to its high spatial resolution (Willcocks, 2016). Depending on the application in clinical studies, Dixon MRI continues to be a powerful imaging tool for precise measures of fat fraction in DMD.
Cardiac MRI (CMR)
Cardiac MRI utilizes electrocardiogram (ECG)-gated sequences to capture high-resolution images of the heart. As DMD progresses, monitoring of the heart becomes vital as cardiac is a leading cause of demise in the DMD patient population, alongside respiratory failure (McNally, 2015). Cardiac involvement in DMD begins around 10 years-of-age characterized by ECG abnormalities and sinus tachycardia (McNally, 2015; van Westering, 2015). Myocardial damage at the cellular level precedes significant cardiac dysfunction, so its quantification is vital in DMD monitoring activities (Khairallah, 2007; Jung, 2008; McNally, 2015). Cardiac magnetic resonance imaging (CMR) using a myocardium tagging approach to calculate peak strain has been shown to be a sensitive measure to detect abnormalities in cardiac function and contractility in DMD without the use of any contrast agent (as in Late Gadolinium Enhancement imaging). In a longitudinal study over 5 years, Batra et al. (Batra, 2022) identified that with normal left ventricular function, composite and regional strain is detected at an early age. This study supports cardiac strain as an early biomarker for cardiac dysfunction in DMD.
What are the current treatment options for DMD and what options are being investigated in clinical trials?
Currently, there is no cure for DMD. However, disease-modifying treatments and supportive therapies are available to extend duration of life and increase quality of life (Birnkrant, 2018). Given the impaired muscle repair mechanisms, clinical trials emphasize early detection and interventions to retain muscle integrity for as long as possible.
Effective therapies must overcome several barriers, including the need for systemic treatment, sustaining treatment efficacy, and minimizing side-effects of treatment (Heydemann, 2023). The most widely used standard-of-care treatments include corticosteroids and physical therapies. Corticosteroids have demonstrated efficacy and have been effective in slowing disease progression and preserving muscle function, but do not address all barriers to treatment. Long-term corticosteroid use has major side-effects, such as mood swings, osteoporosis, and weight gain (Heydemann, 2023). Physical therapies and mobility devices are effective at slowing muscle damage by strengthening supporting muscle groups and reducing mechanical stress. While effective at slowing progression and provides relief of symptoms, current treatments do not address the underlying genetic cause of DMD and should be used in conjunction with other therapies that address the root genetic cause of DMD.
Emerging therapies, such as stem cell repair and gene therapies, are amongst promising treatments aiming to treat DMD directly at the molecular level of the disease (Heydemann, 2023). One such approach is microdystrophin gene therapy, which aims to introduce a functional, shortened version of the dystrophin gene into muscle cells. Mendell et al. (Mendell, 2020) showed expression of a microdystrophin transgene in 74-96% of biopsied gastrocnemius muscle fibres when delivered to four ambulatory boys (aged 4-7 years) under a skeletal and cardiac muscle-specific promotor. All patients showed functional improvement in the North Star Ambulatory Assessment and reduced creatine kinase levels for 1 year after treatment with mild to moderate adverse events reported. A limitation of this study is that data is only reflective of a small sample of muscle by biopsy. To address this issue, Willcocks et al. (Willcocks, 2021) utilized qMRI and qMRS to assess the impact of the microdystrophin gene transfer in larger muscle groups. Compared to an age-matched natural history cohort treated with standard-of-care, three boys who received the microdystrophin gene transfer had minimal fat infiltration observed in biceps femoris long head and adductor magus measured by MRS. The imaging results in this report demonstrate the value of non-invasive quantitative MRI and quantitative MRS in examining the efficacy of novel therapeutics. Ongoing research integrating biomarker imaging with emerging therapies will be necessary for optimizing treatment strategies and improving clinical outcomes for individuals with DMD.
Our team would be happy to answer any questions about MRI Biomarkers for Duchenne Muscular Dystrophy (DMD) or provide specific information about our other Imaging services.
Discover more about our Imaging Services
Related Content
Up-to-date information on best practices related to the use of neuroimaging in clinical trials of neurological diseases.
MRI Biomarkers in Clinical Trials of Huntington’s Disease
An overview of the use of structural and diffusion MRI imaging biomarkers for Huntington’s disease (HD) clinical trials.

Neuroimaging Biomarkers for Tuberous Sclerosis Complex (TSC)
Overview of brain structural MRI and diffusion-weighted imaging biomarkers to monitor efficacy of disease-modifying therapeutics in clinical trials of TSC.
Imaging Biomarkers for Friedreich’s Ataxia Clinical Trials
An overview of the use of MRI and DTI imaging biomarkers for Friedreich’s ataxia (FRDA) in research studies & multi-center clinical trials.
MRI in Clinical Trials of Multiple System Atrophy (MSA)
This resource provides an overview of the utility of volumetric MRI and diffusion-weighted imaging (DWI) as biomarkers in research studies of MSA.