


Shape Analysis of Subcortical Brain Structures for Tracking & Predicting Hallmarks of Alzheimer’s Disease
Detecting early Alzheimer’s changes through subtle shifts in brain shape.
Section 1
Key Takeaways
The shape of subcortical structures provides an accurate quantification of brain atrophy in Mild Cognitive Impairment (MCI).
The shape of the hippocampus is a sensitive biomarker for tracking the longitudinal progression of atrophy in MCI.
Morphological changes in the hippocampus can serve an effective biomarker that accurately reflect strong associations with Tau PET SUVR.
Hippocampal shape is a sensitive biomarker able to predict increase in Tau PET SUVR in the hippocampus itself and in the entorhinal cortex.
The hippocampus and amygdala shape reflect strong associations with CSF and plasma biomarkers of AD pathology and neurodegeneration.
Subcortical brain regions, such as the hippocampus and amygdala, are critical for various cognitive, emotional, and motor functions. Atrophy in Alzheimer’s disease (AD) and other neurodegenerative diseases are typically assessed through volumetric measurements of these subcortical structures. Since atrophy is usually detected at later stages of AD progression, subtle disease-related changes in the shape, cortical folding, or surface deformation of subcortical structures are better detected by applying morphological shape analysis techniques.
In the current study, we applied a morphological surface shape analysis for characterizing the longitudinal patterns of subcortical structures in Alzheimer’s disease. For that purpose, we used a local shape metric that is estimated from the nonlinear deformations that measure the spatial displacement of individual outer surfaces of subcortical regions with respect to a reference anatomical model. We also used this surface-based metric to perform associations and actual out-of-the-sample predictions of other imaging and non-imaging AD biomarkers, such as tau accumulation as measured by PET imaging, as well as CSF and plasma biomarkers.
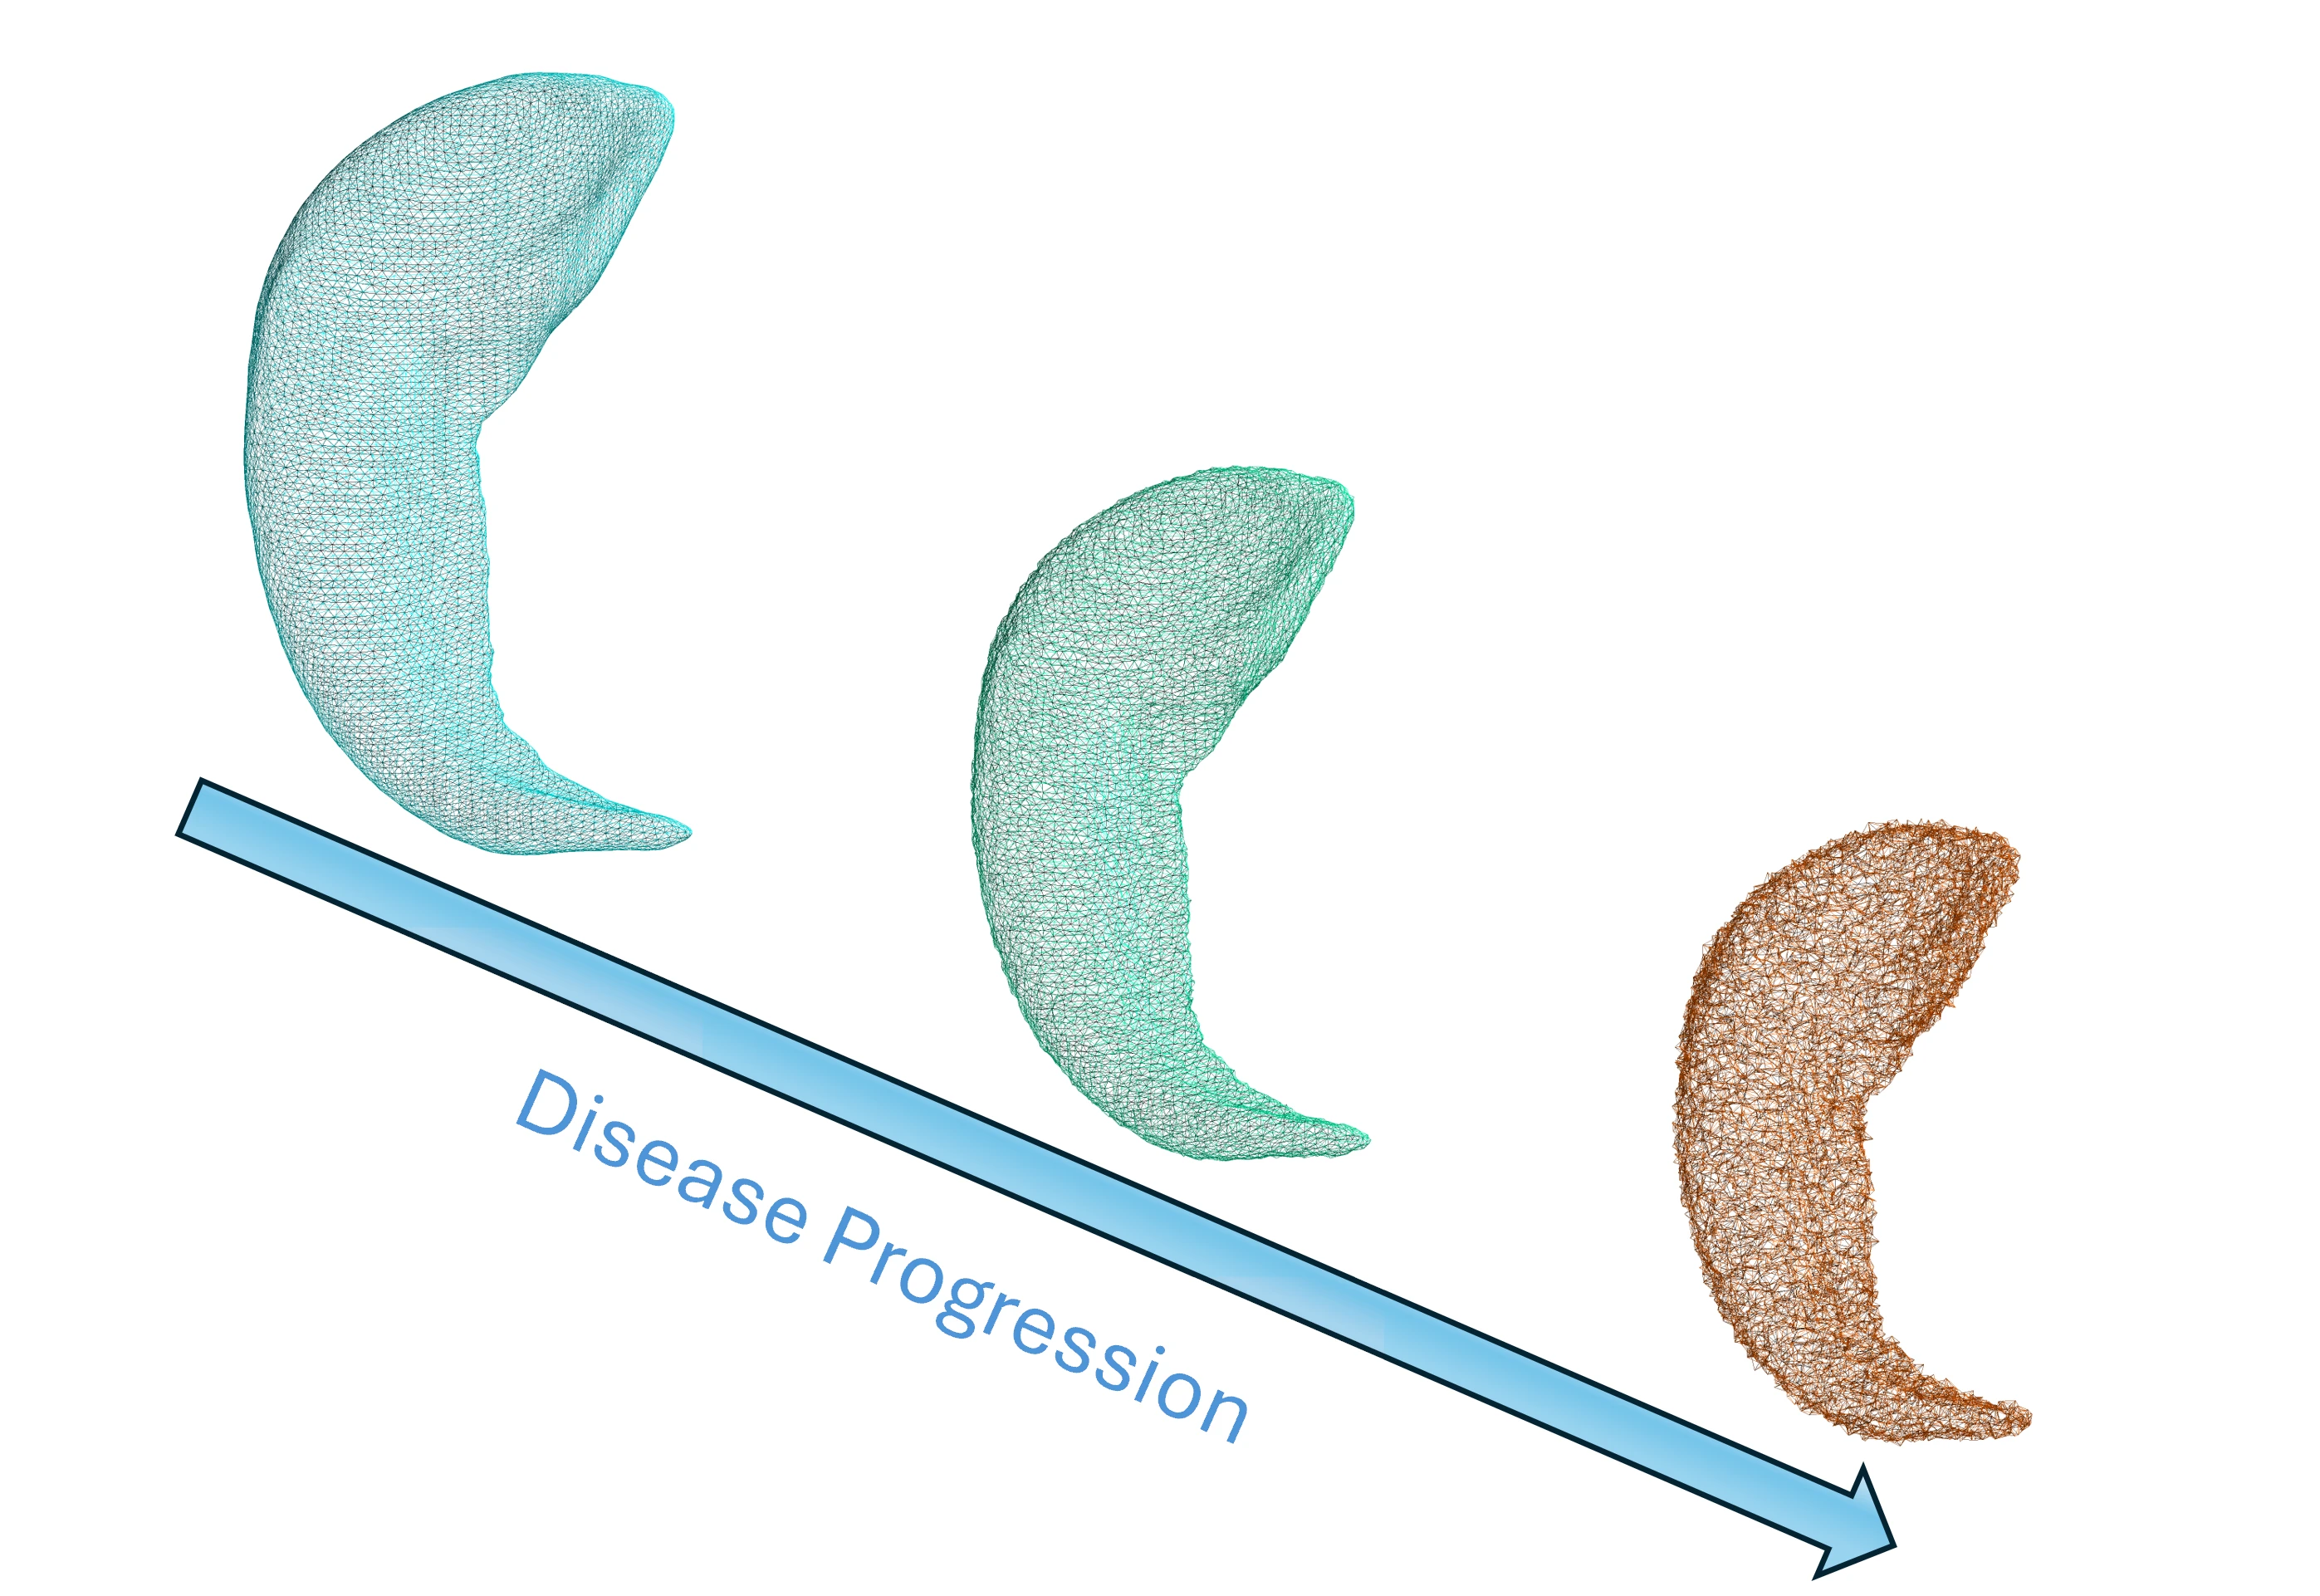
Our findings revealed that local deformations in the shape of subcortical structures, like the hippocampus, is a sensitive biomarker for tracking the longitudinal progression of anatomical morphological changes in MCI. We also showed that the hippocampus and amygdala surface deformations are highly correlated with other hallmarks of AD, including early tau accumulation within the entorhinal cortex and abnormal fluid biomarkers of Aβ pathology and neurodegeneration. Finally, we also derived predictive models that accurately recovered observed Tau PET SUVR measurements, suggesting the possibility to use anatomical T1-weighted MRI data as a surrogate of Tau PET for eligibility screening in clinical trials of disease-modifying therapeutics.
Slide Presentation
Background
Background
Morphological biomarkers of the brain, particularly in subcortical structures, refer to measurable changes in brain anatomy that can indicate disease processes or alterations in cognitive and motor functions. Structural changes in these regions, particularly in hippocampus and amygdala, have been implicated in Alzheimer’s disease (AD) and other age-related and neurodegenerative diseases.
The volumetric quantification of subcortical structures has been the conventional and widely accepted technique for tracking anatomical changes. Complementarily, surface-based biomarkers of subcortical areas focus on their outer surface morphology of and are particularly useful in detecting local atrophy, cortical folding, or surface deformation along spatial directions. Indeed, it has been consistently reported that subcortical structures may undergo subtle, but significant, morphological changes in several diseases that might not be apparent through volumetric measures alone.
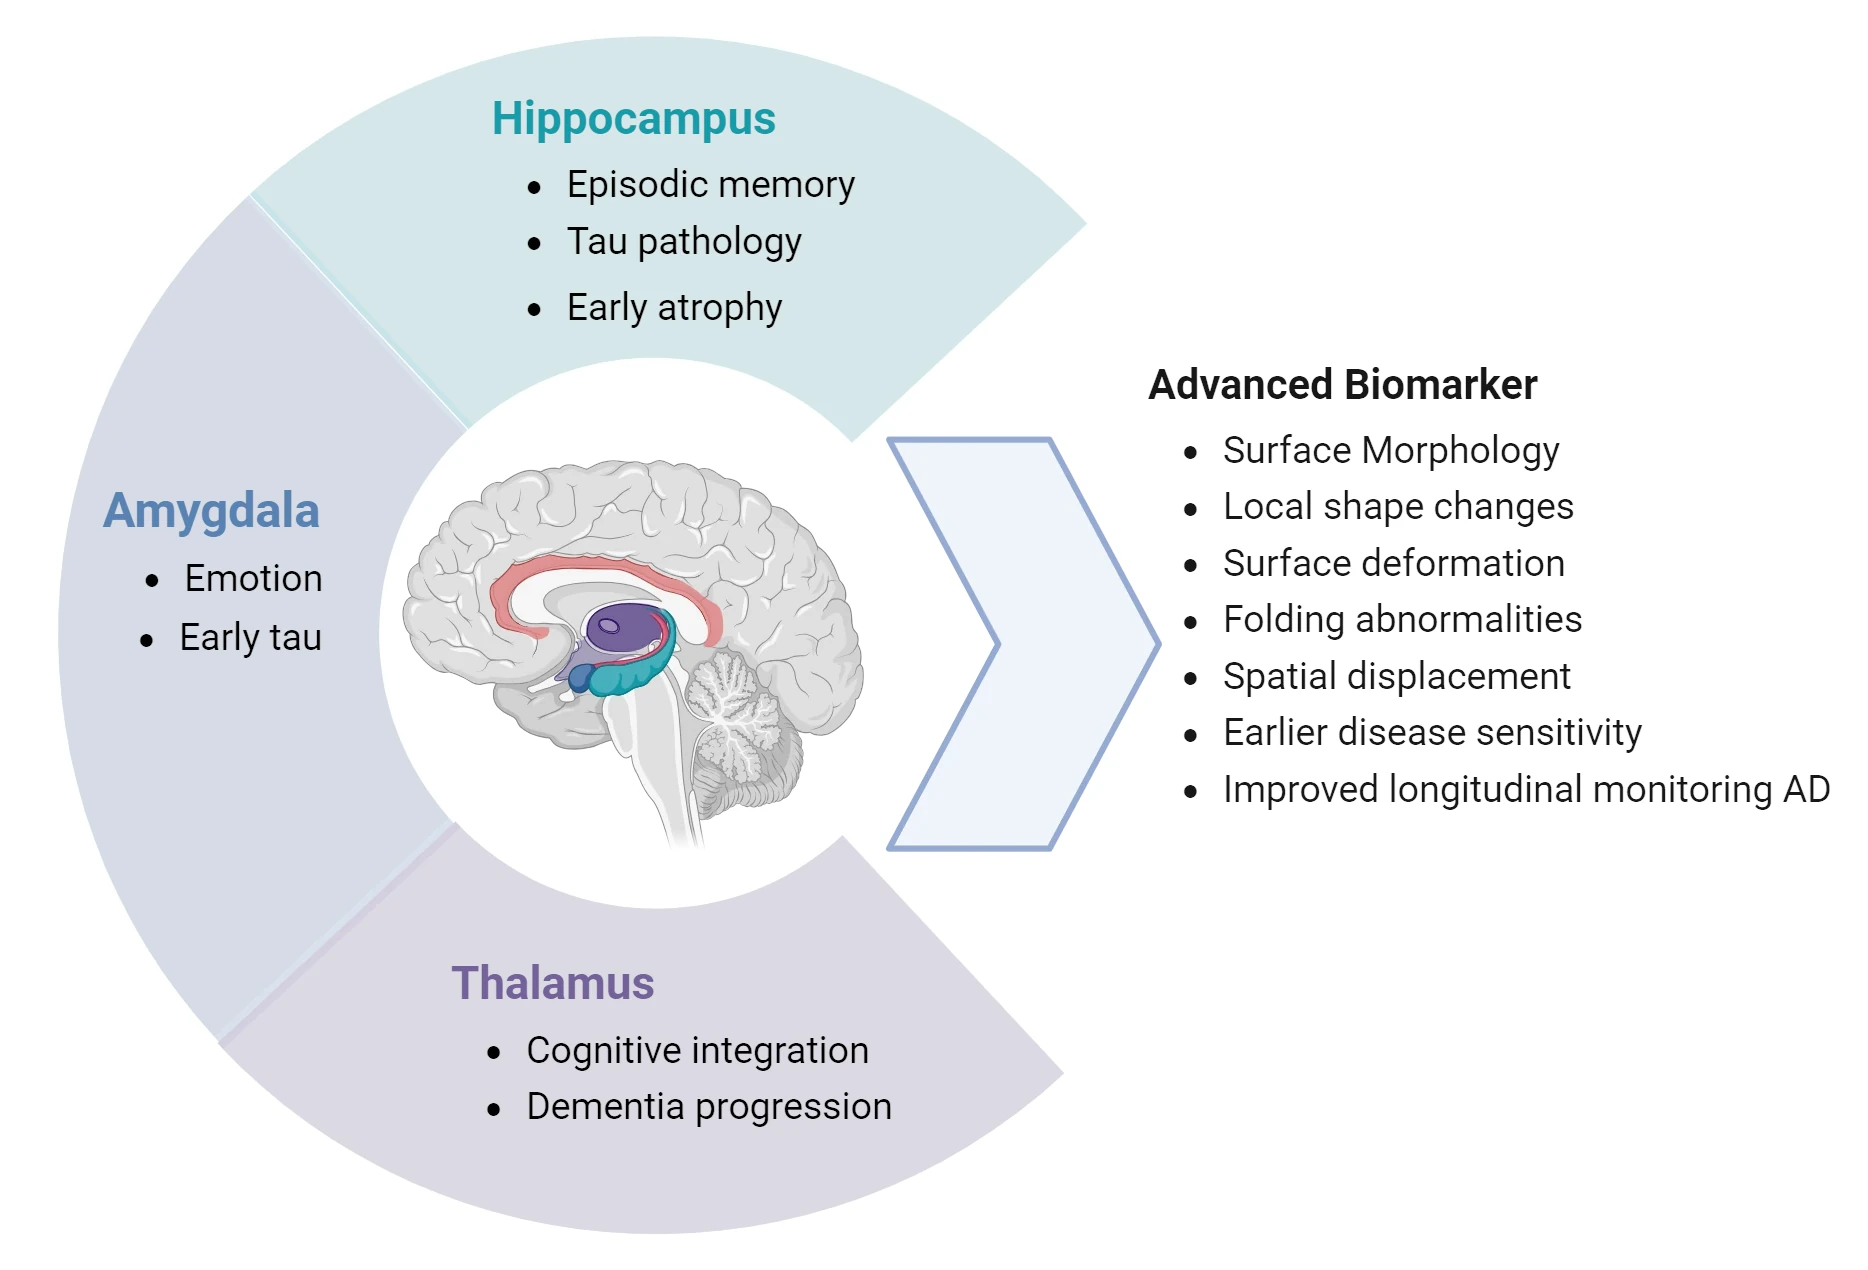
Subcortical structures, such as the hippocampus, are core elements in Alzheimer’s disease. Indeed, the hippocampus is typically associated with AD-characteristic episodic memory syndrome and downstream neurodegeneration, and hippocampal atrophy is closely linked to tau-related medial temporal pathology. Apart from the hippocampus, there has been a recent interest in studying the role of other subcortical structures in the progression of AD pathology and cognitive decline. For instance, several studies have recently identified the amygdala as a region showing early neurofibrillary tau pathology and describe the thalamus as a key region in dementia due to thalamic pathology that may contribute to cognitive decline and behavioral symptoms. However, very little is known about the ability of using morphological shape analysis of these structures to track the disease progression and detect significant changes in longitudinal settings.
Introduction and Objectives
Introduction
Subcortical structures, such as the hippocampus, are core elements in Alzheimer’s disease. Indeed, the hippocampus is typically associated with AD-characteristic episodic memory syndrome and downstream neurodegeneration, and hippocampal atrophy is closely linked to tau-related medial temporal pathology. Apart from the hippocampus, there has been a recent interest in studying the role of other subcortical structures in the progression of AD pathology and cognitive decline. For instance, several studies have recently identified the amygdala as a region showing early neurofibrillary tau pathology and describe the thalamus as a key region in dementia due to thalamic pathology that might contribute to cognitive decline and behavioral symptoms. However, very little is known about the ability of using morphological shape analysis of these structures to track the disease progression and detect significant changes in longitudinal settings.
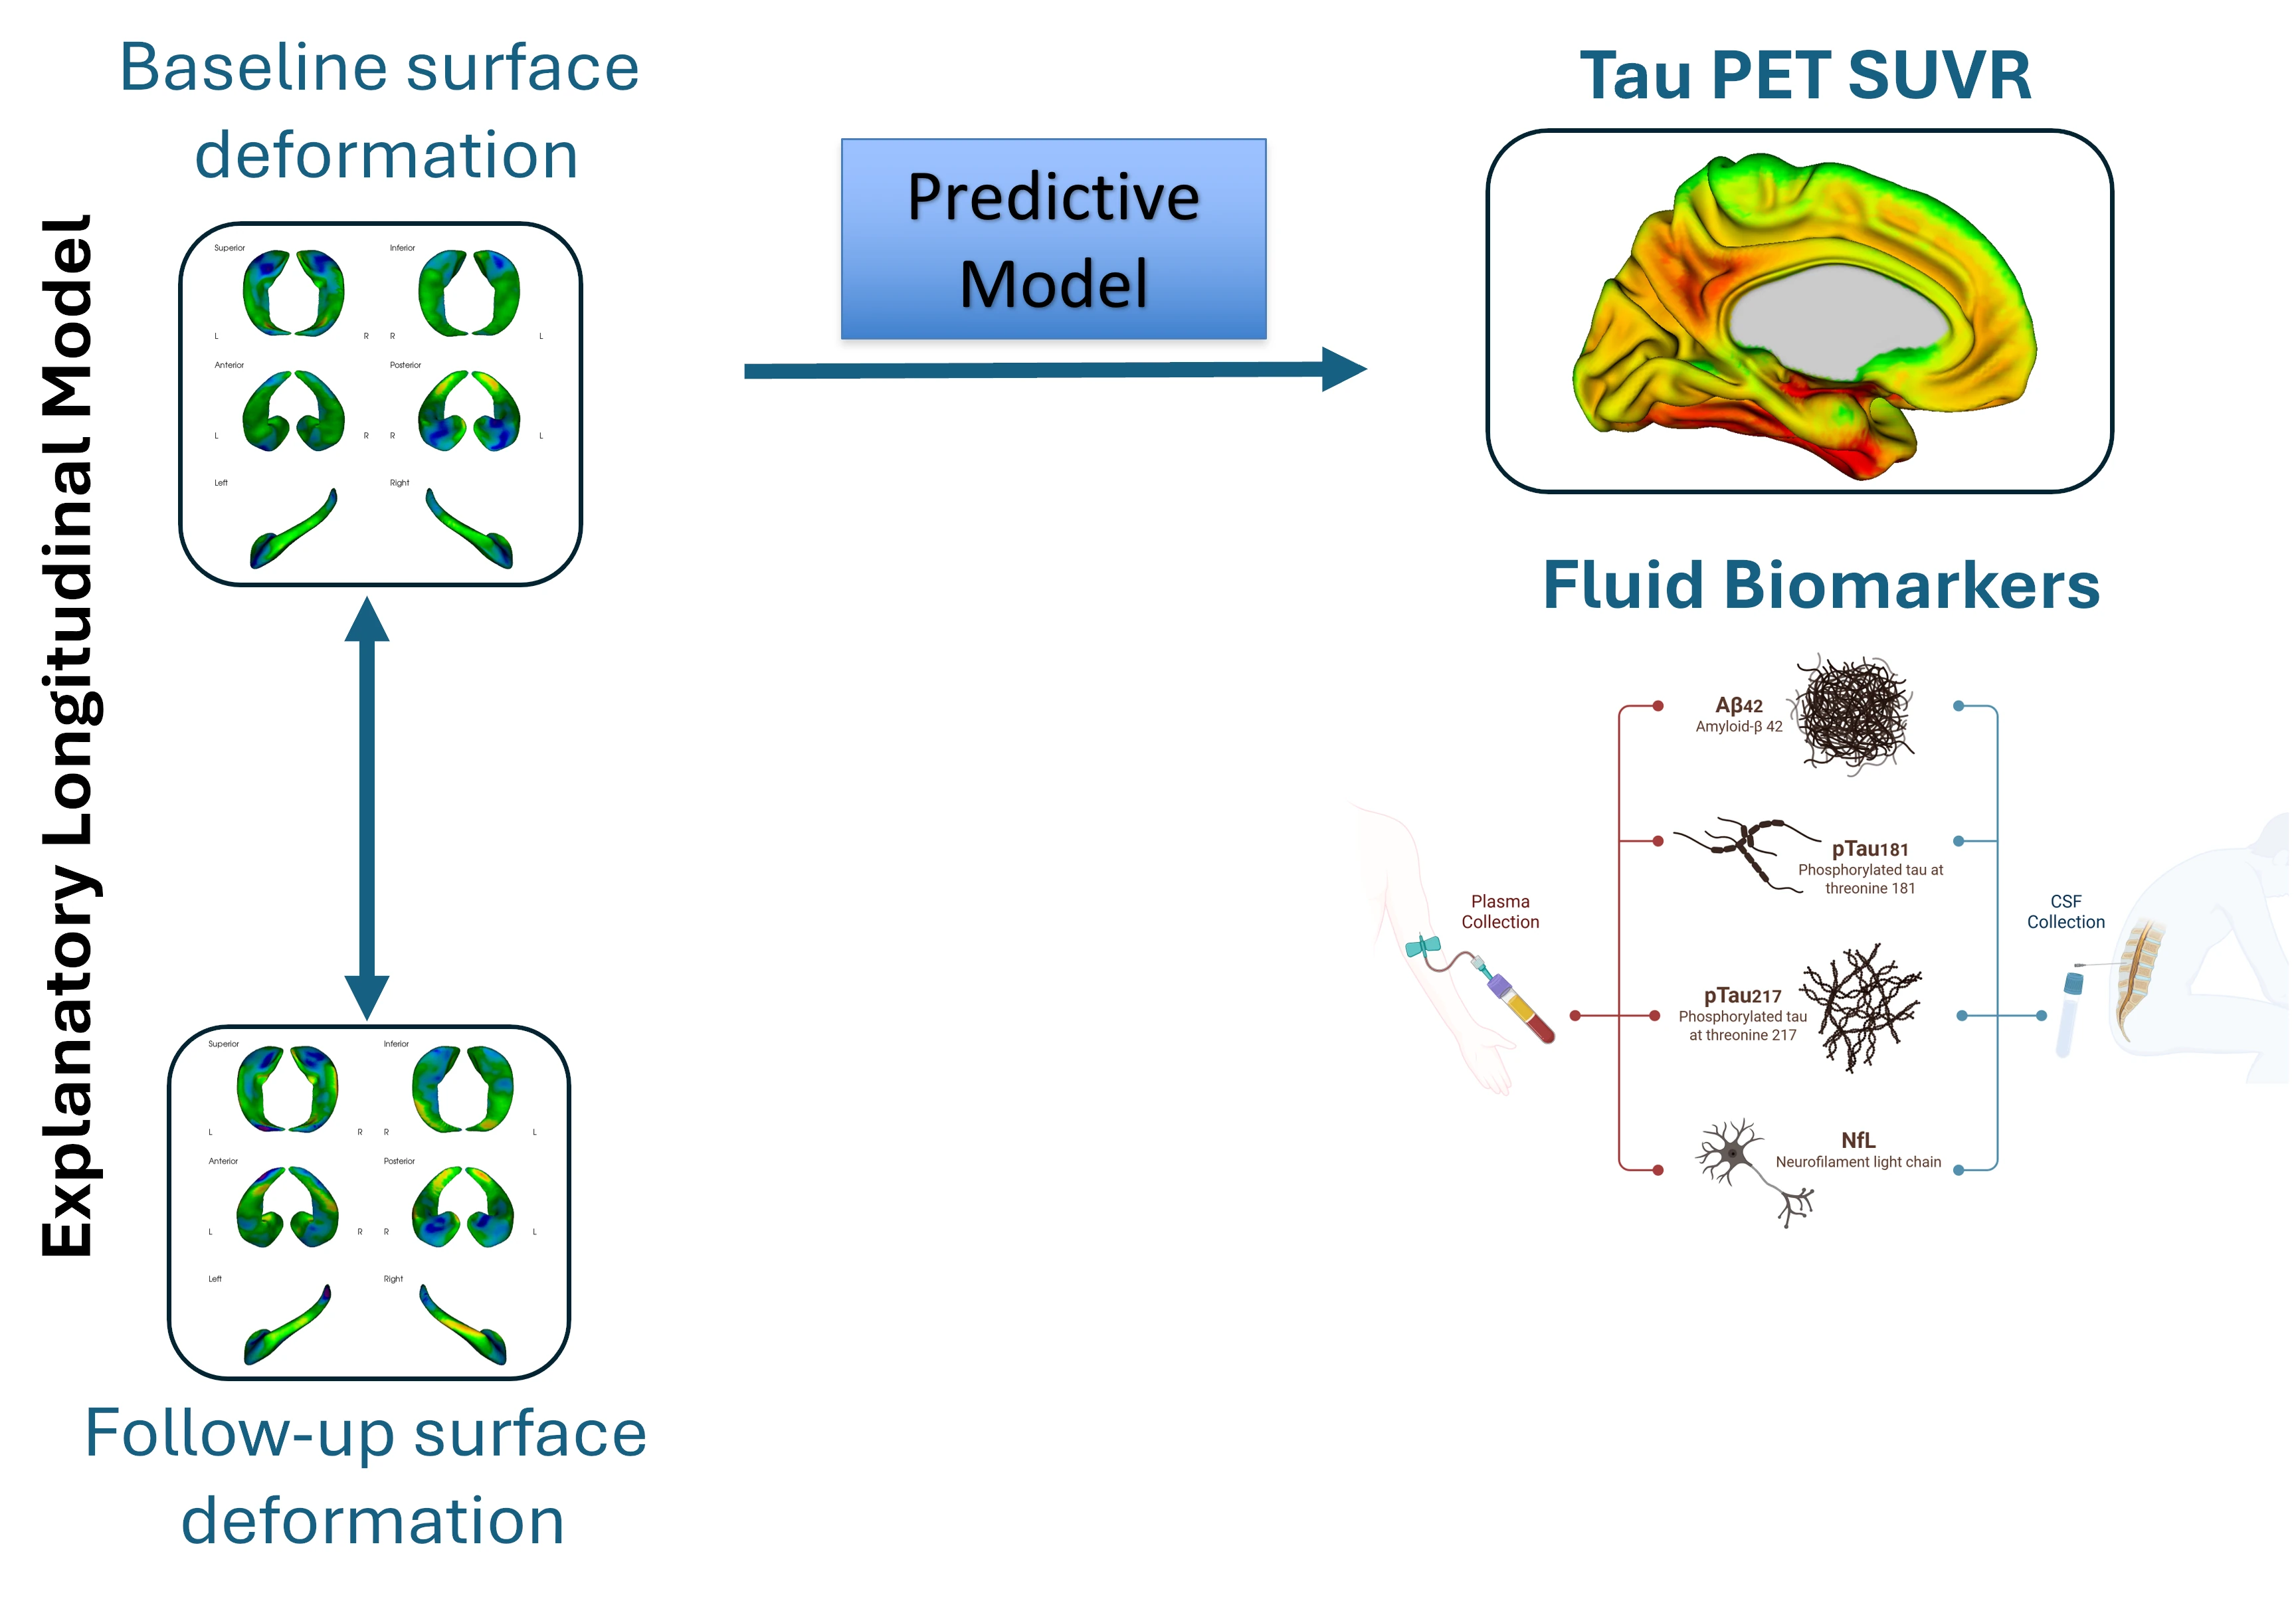
Schematic representation for the capabilities of using the surface-based deformation in AD. Surface deformations analysis on subcortical structures can be used to explain longitudinal morphological changes due to AD progression. Additionally, surface deformations can enter as variables of interest in multivariate models to generate actual predictions of Tau PET as well as CSF/plasma biomarkers in early stages of AD.
We defined the projection of the of the nonlinear template-to-subject transformation onto the direction of the normal vector to the surface as our local measure of inward or outward displacement. Using this metric, we showed that such quantification of the local deformations in the shape of subcortical structures, like the hippocampus and amygdala, is a sensitive biomarker for tracking the longitudinal progression of morphological changes and atrophy in AD. We also determined that local deformations in the shape of the hippocampus are associated with other imaging and non-imaging hallmarks of AD, including CSF and plasma biomarkers. Importantly, we show that deformations in hippocampus surface can predict the Tau PET SUVR in the hippocampus itself and in the entorhinal cortex, a very early hallmark of AD.
Study Data
Patient Demographics & Clinical Features at Baseline
Clinical Features | Cohort for Longitudinal Analysis† | ||
Cognitively Normal | Mild Cognitive Impairment | Alzheimer’s Disease | |
N (Baseline) | 324 | 401 | 54 |
Sex (F/M) | 177/147 | 174/227 | 28/26 |
Age (years) | 73.44 ± 6.64 | 72.76 ± 7.65 | 73.65 ± 6.89 |
APOEε4 (C/NC) | 110/214 | 197/204 | 29/25 |
† Diagnosis at Baseline
The data used for analysis was obtained from the ADNI database. N=1592 MRI scans from Cognitively Normal (CN), Mild Cognitive Impairment (MCI), and Alzheimer’s Disease (AD) participants were included in the longitudinal analysis of subcortical deformations, where each subject had at least two time points including a baseline visit. After filtering this cohort by image and processing quality, the resulting scans were labeled as having an initial baseline visit as well as time visits for 24 and 48 months after baseline. Overall, the average age of the participants at baseline visit was approximately 73 years and there was no statistically significant difference in age among the three diagnosis groups. There was a statistically significant association between Sex and Clinical Diagnosis, which can be explained by the larger number of males than females in the MCI group. Similarly, there was a statistically significant association between APOEε4 and Clinical Diagnosis due to the larger number of APOEε4 non carriers in the CN group.
Clinical Features | Cohort for Cross-sectional Analysis† | |
Cognitively Normal | Mild Cognitive Impairment | |
N (Baseline) | 574 | 717 |
Sex (F/M) | 326/248 | 311/406 |
Age (years) | 59.52 ± 13.08 | 64.63 ± 8.77 |
APOEε4 (C/NC) | 183/391 | 343/374 |
† Diagnosis at Baseline
The cross-sectional and predictive model analyses were performed on a cohort of N=1291 scans from CN and MCI subjects at their first available visit. For correlational analysis with other imaging (e.g. Tau PET, FDG PET) and non-imaging (e.g. plasma, CSF) biomarkers, this sample was filtered to match the acquisition dates (within a 90-day window) between the MRI scans and the corresponding biomarkers. The average age at baseline visit for the participants in this cohort was approximately 73 years and there was no statistically significant age difference between CN and MCI. There was a statistically significant association between Sex and Clinical Diagnosis, as well as between APOEε4 and Clinical Diagnosis.
Image Processing
Image Processing
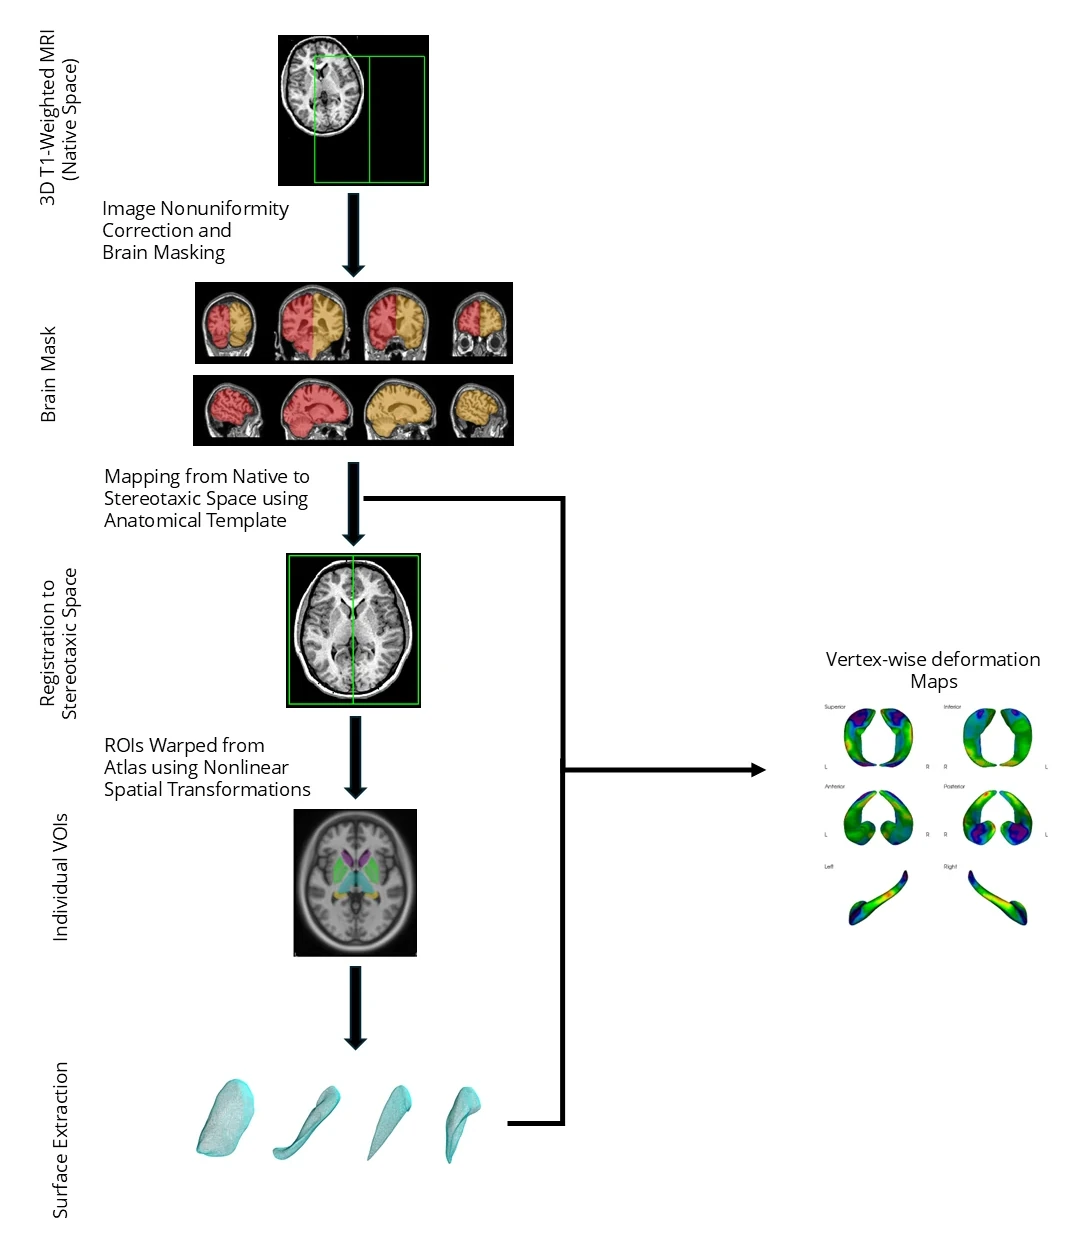
Biospective’s fully-automated PIANO™ pipeline for vertexwise shape analysis of subcortical structures was used to investigate cognitively normal, MCI, and AD populations. The registered anatomical images can be used to extract the outer surface of subcortical structures and compute vertexwise maps of the nonlinear deformations along the surface normal.
This illustration provides a high-level overview of the various steps involved in PIANO™, Biospective’s automated structural MRI processing "pipeline". PIANO™ is a configurable, modular, pipeline-based system for fully automated processing of multi-modality images. PIANO™ is designed for high-throughput processing of large-scale, multi-center, neuroimaging data. Briefly 3D T1-weighted MRI scans underwent:
Image non-uniformity correction using the N3 algorithm, brain masking, linear spatial transformation to “stereotaxic space”, and nonlinear transformation to a pre-defined “template space”.
Computation of the nonlinear deformation fields associated with the spatial transformation to the template space.
Specific VOIs were defined anatomically, explicitly on a template, or generated implicitly using a deep-learning model, and were combined with subject-specific tissue classification, as needed.
The outer surfaces of the several VOIs, including the Hippocampus, Amygdala, Caudate, Thalamus, and Putamen were automatically extracted using the marching cubes algorithm.
The local deformation on the surfaces was quantified with the projection of the of the nonlinear template-to-subject transformation onto the normal vector to the template surface.
Vertexwise shape analysis of the subcortical VOIs was derived from the underlying deformation maps along the normal to the outer surfaces.
Longitudinal Analysis of Hippocampus Deformations in MCI
Longitudinal Analysis of Hippocampus Deformations in MCI
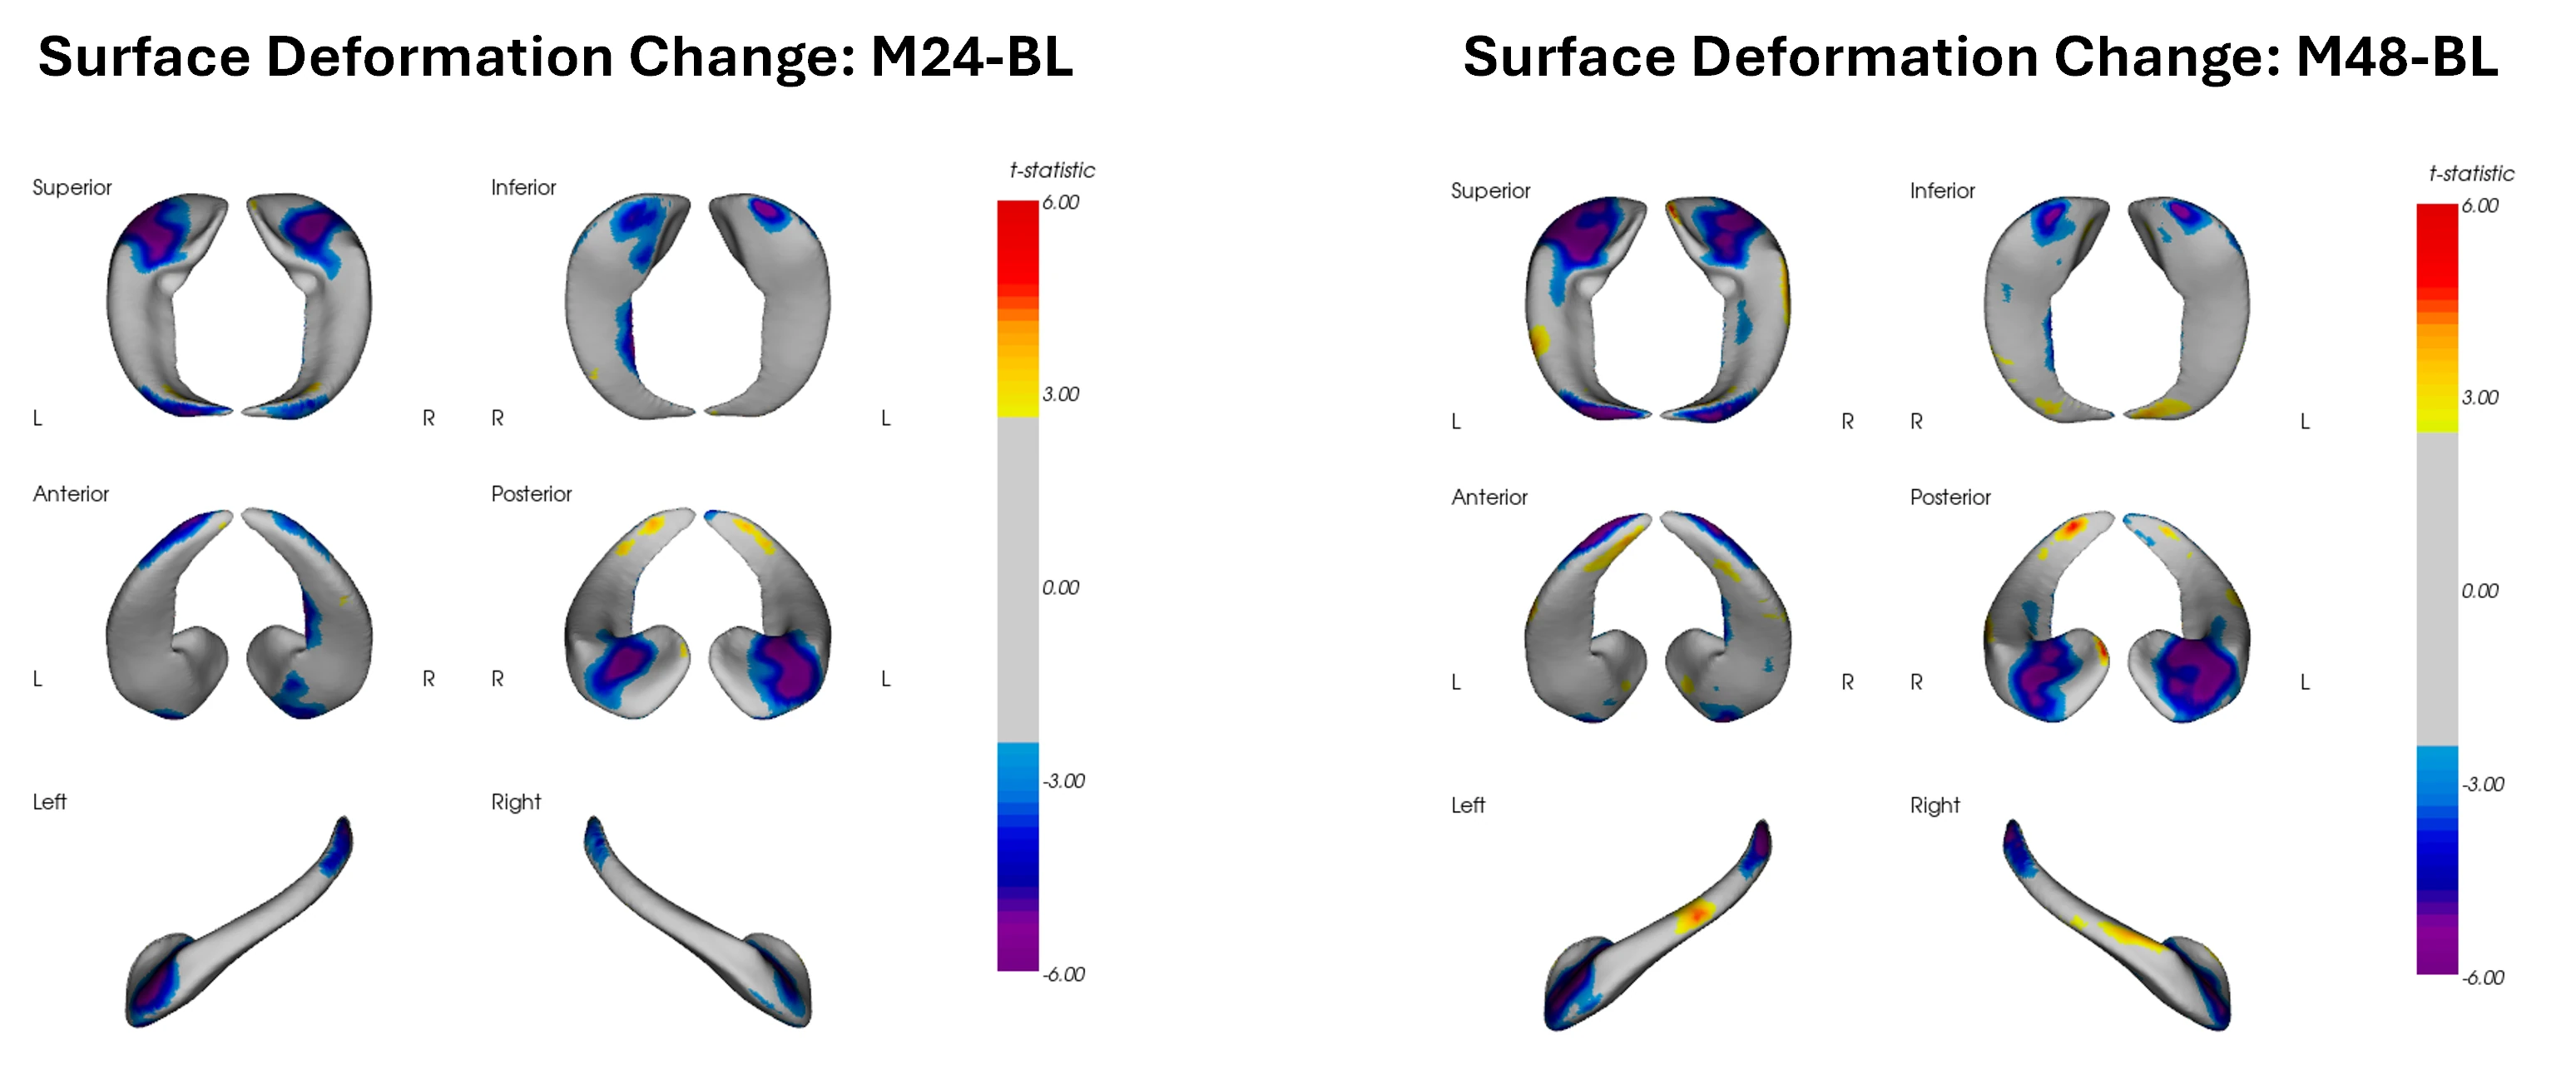
Spatial representation of the statistically significant longitudinal changes of deformations in the hippocampus surface from MCI subjects. The negative sign effects correspond to an inward deformation change along the surface’s normal. Those changes become stronger over time, providing a local quantitative assessment of early atrophy progression.
A mixed-effects longitudinal model was fitted to the surface deformation data to assess the main effect of change over time for each of the groups under study, namely Cognitive Normal, MCI, and AD. The set of covariates included age at baseline and sex.
After correction for multiple comparisons using a False Discovery Rate (FDR) approach, statistically significant longitudinal effects in local surface deformations of the hippocampus were detected in MCI subjects. Most of these significant changes were located in the head of the hippocampus and reflected an inward displacement along the surface’s normal, providing a local assessment of atrophy progression over time. The significant changes of deformations relative to the baseline time point appeared to become stronger over time.
Longitudinal Analysis of Hippocampus Deformations in Cognitive Normal and AD
Longitudinal Analysis of Hippocampus Deformations in Cognitively Normal and AD Subjects
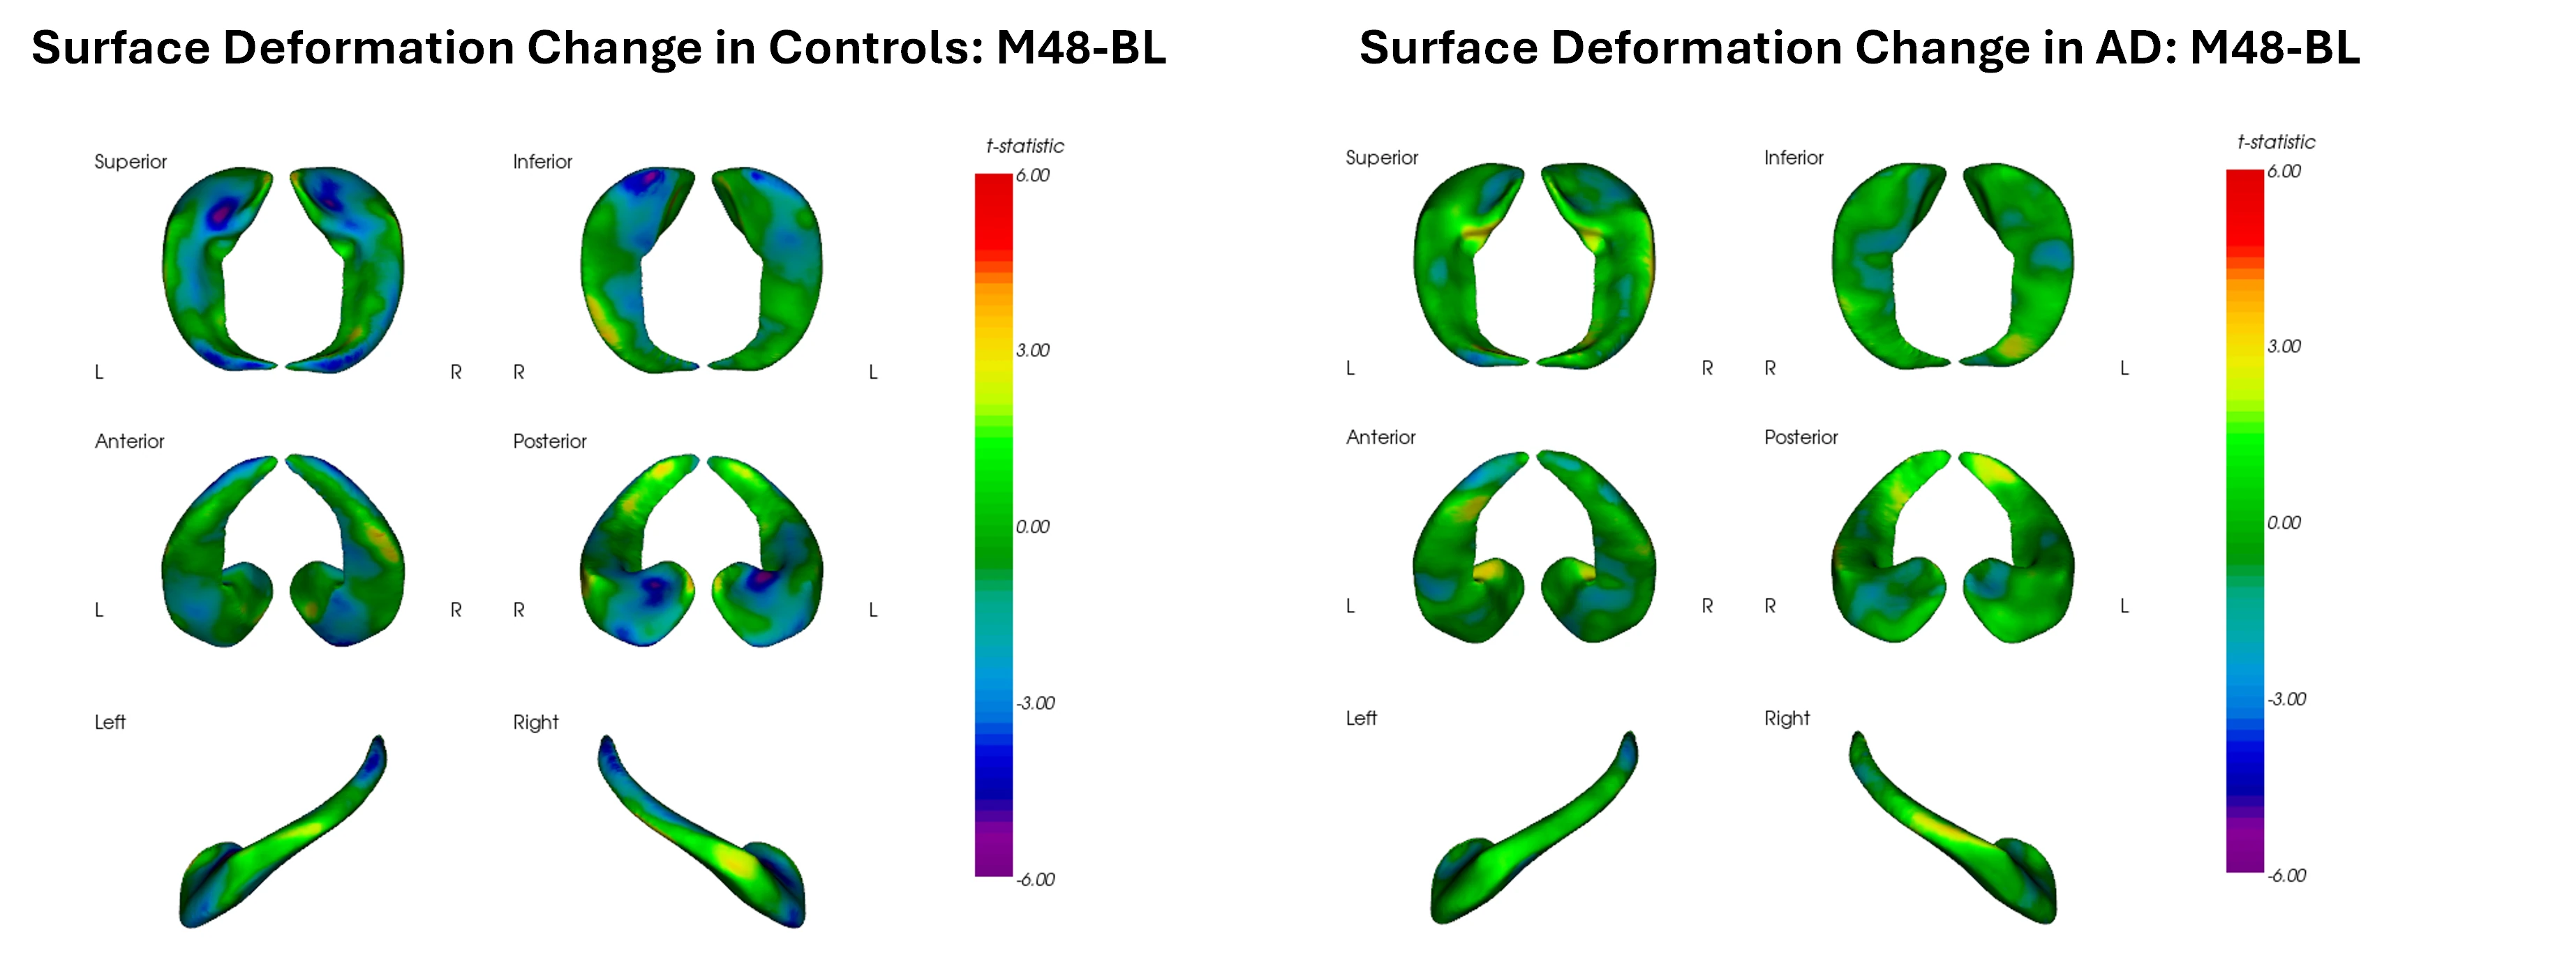
Spatial representation of the statistically significant changes in deformations of the hippocampus after 48 months of the baseline visit for Cognitively Normal (left panel) and AD (right panel) subjects. The longitudinal changes did not result statistically significant as for the case of MCI subjects, reflecting both the sensitivity and specificity of the surface deformation metric for the diagnosis and tracking of MCI.
Association of Hippocampus Surface Deformations with Tau PET SUVR
Association of Hippocampus Surface Deformations with
Tau PET SUVR
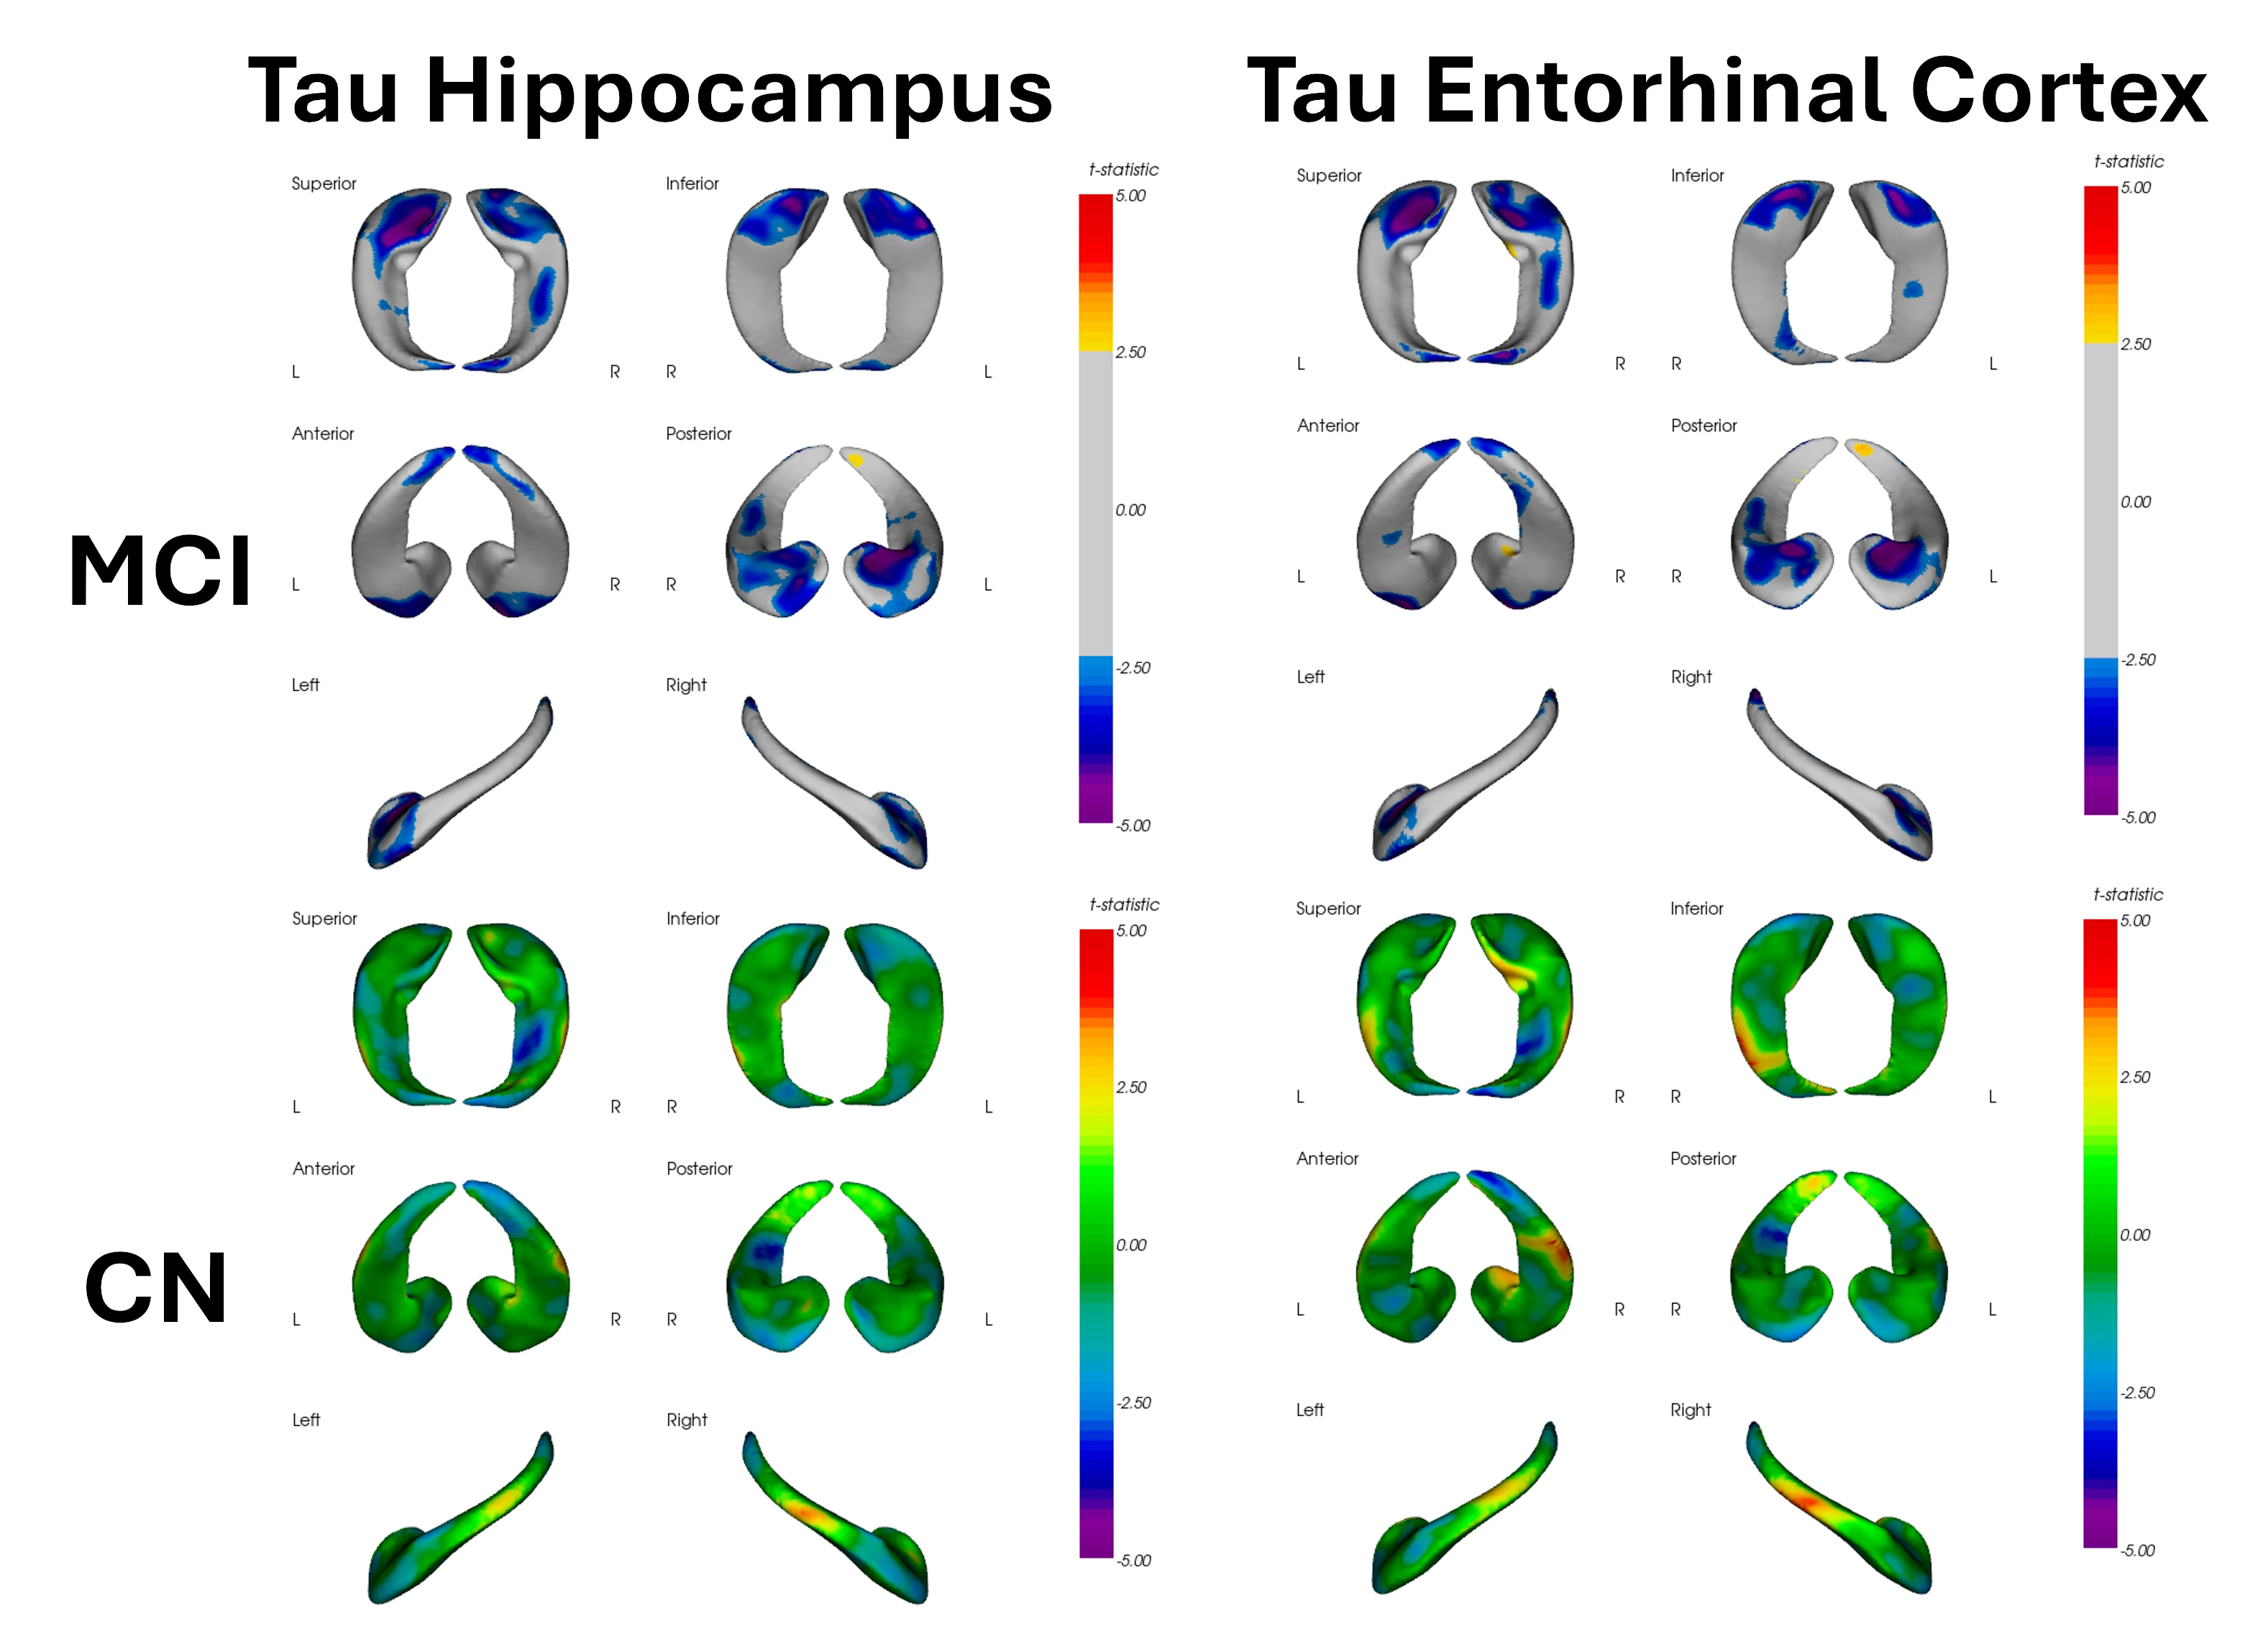
Association between the hippocampus surface deformations and Tau PET SUVR in both the hippocampus itself and the entorhinal cortex. The association was strong in some areas of the hippocampus for MCI subjects only.
A cross-sectional linear model was fitted to the hippocampus surface deformation data in CN and MCI subjects at baseline to assess its association with Tau PET SUVR. The set of covariates included age, sex, and APOEε4 genotype.
After multiple comparisons correction, some local shape deformations in the head of the hippocampus had a statistically significant association with the accumulation of tau in both the hippocampus and the entorhinal cortex for the population of MCI subjects only. Remarkably, the significant clusters of association are mainly located in the head of the hippocampus and anatomically close to the transentorhinal cortex, a well-known region for early localization of tau pathology (Braak stages I/II).
Association of Hippocampus Surface Deformations with Both CSF and Plasma pTau181
Association of Hippocampus Surface Deformations with CSF & Plasma pTau181
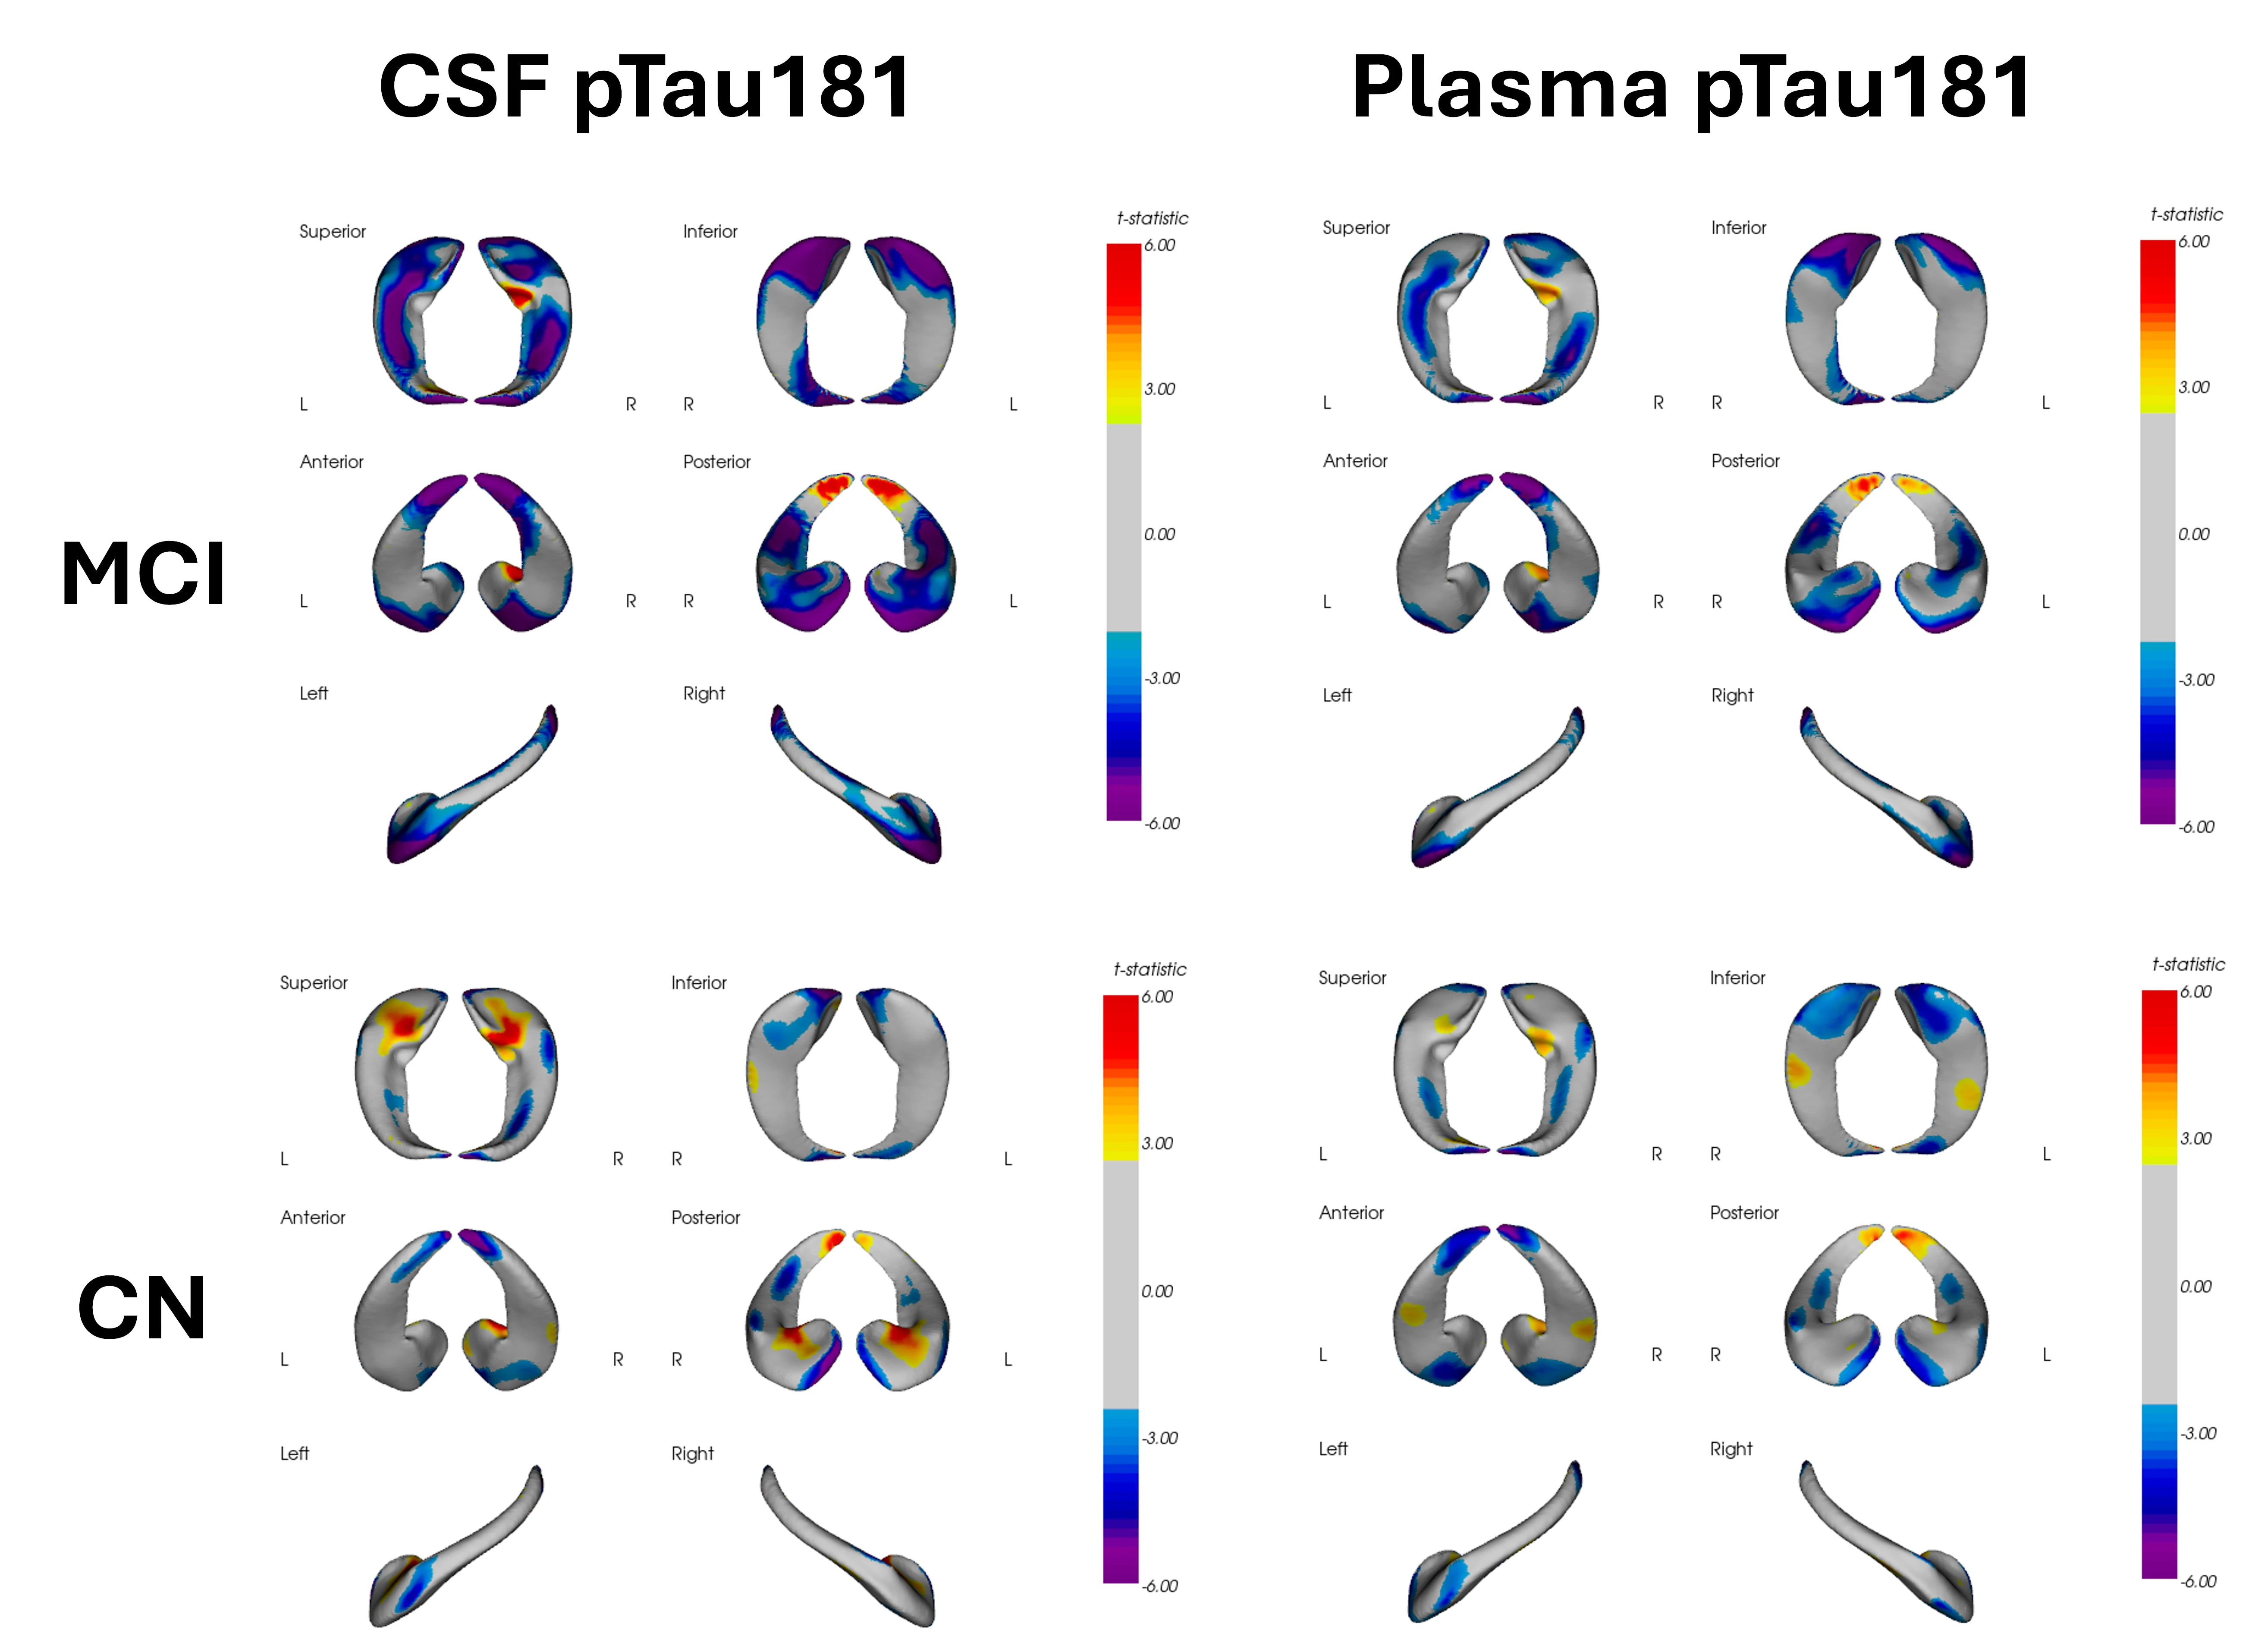
Association of the hippocampus surface deformations with both CSF pTau181 and plasma pTau181. The association seems to be stronger and more spatially extensive for pTau181 as compared to plasma pTau181, particularly for MCI subjects.
A cross-sectional linear model was fitted to the hippocampus surface deformation data in CN and MCI subjects at baseline to assess its association with CSF pTau181 and plasma pTau181. The set of covariates included age, sex, and APOEε4 genotype.
After multiple comparisons correction, the local shape deformations in several regions of the hippocampus had a statistically significant association with both CSF and plasma pTau81, although the strength and spatial extent appeared to be higher for CSF pTau181. Likewise, the relationship between hippocampus surface deformations and CSF/plasma pTau181 appears to be stronger in MCI subjects.
The negative sign in these maps indicates that the increase of the strength of the inward direction deformations in the head and body of the hippocampus is associated with the increase of both CSF and plasma pTau181 levels. In other words, the hippocampus surface inward deformations are closely related to Aβ pathology and phosphorylated tau.
Association of Hippocampus Volume with Both CSF and Plasma ptau181
Association of Hippocampus Volume with CSF & Plasma pTau181
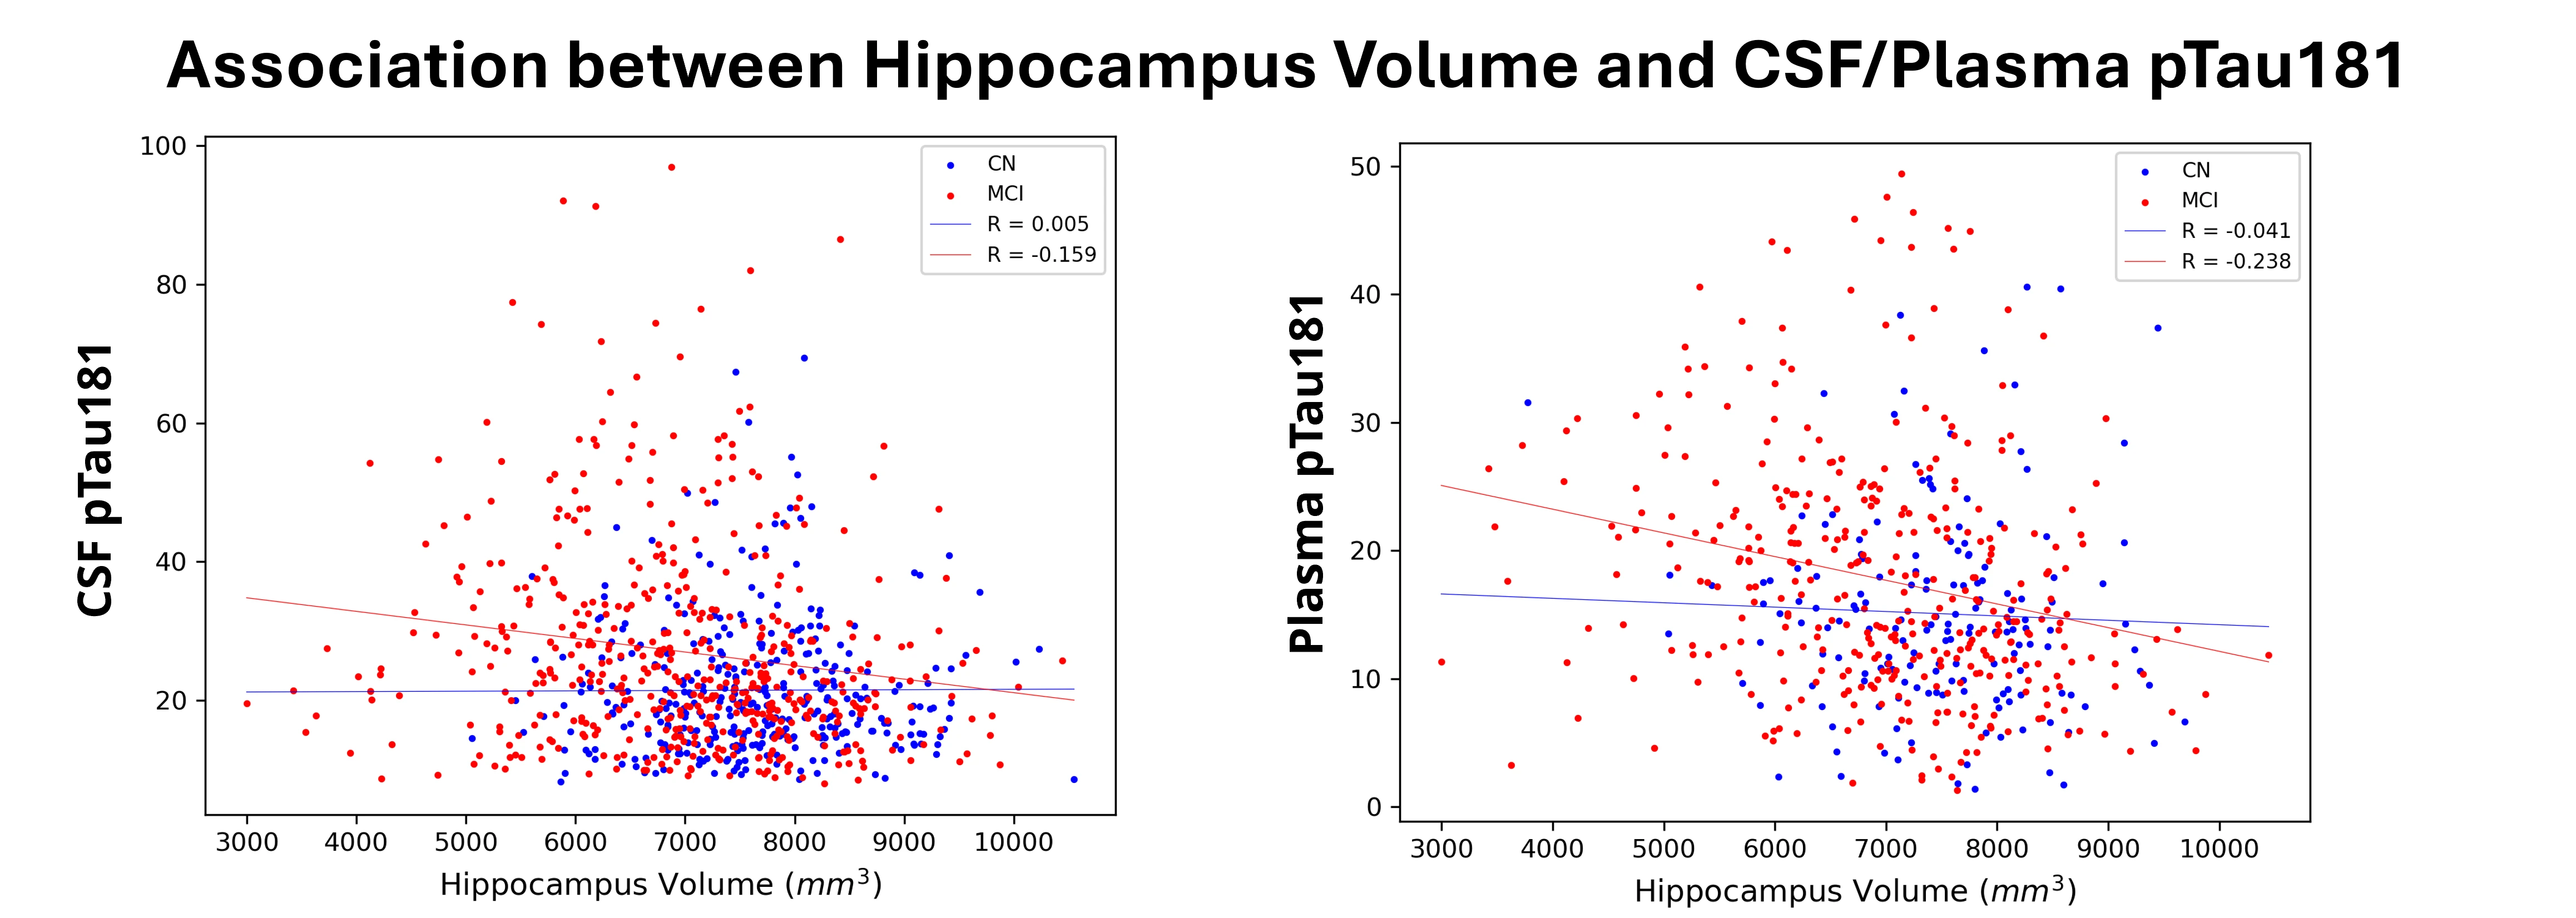
Association of the hippocampus volume with both CSF pTau181 and plasma pTau181. Only a moderate correlation between the hippocampus volume for both fluid biomarkers in MCI subjects, but no significant correlation in CN subjects.
A Pearson’s correlation analysis was computed between the hippocampus volume and both CSF pTau181 and plasma pTau181 for CN and MCI subjects.
For MCI subjects we obtained a moderate correlation between the hippocampus volume and each of the two fluid biomarkers of pathology. However, no significant correlations were found for the case of cognitively normal subjects. As compared with our data on the previous slide, this finding illustrates that the hippocampus surface deformations are more sensitive than volume for revealing associations of the hippocampus shape with both CSF and plasma pTau181 in cognitively normal and MCI subjects.
Association of Hippocampus Surface Deformations with Both Plasma NFL and GFAP Biomarkers
Association of Hippocampus Surface Deformations with Plasma NfL & GFAP Biomarkers
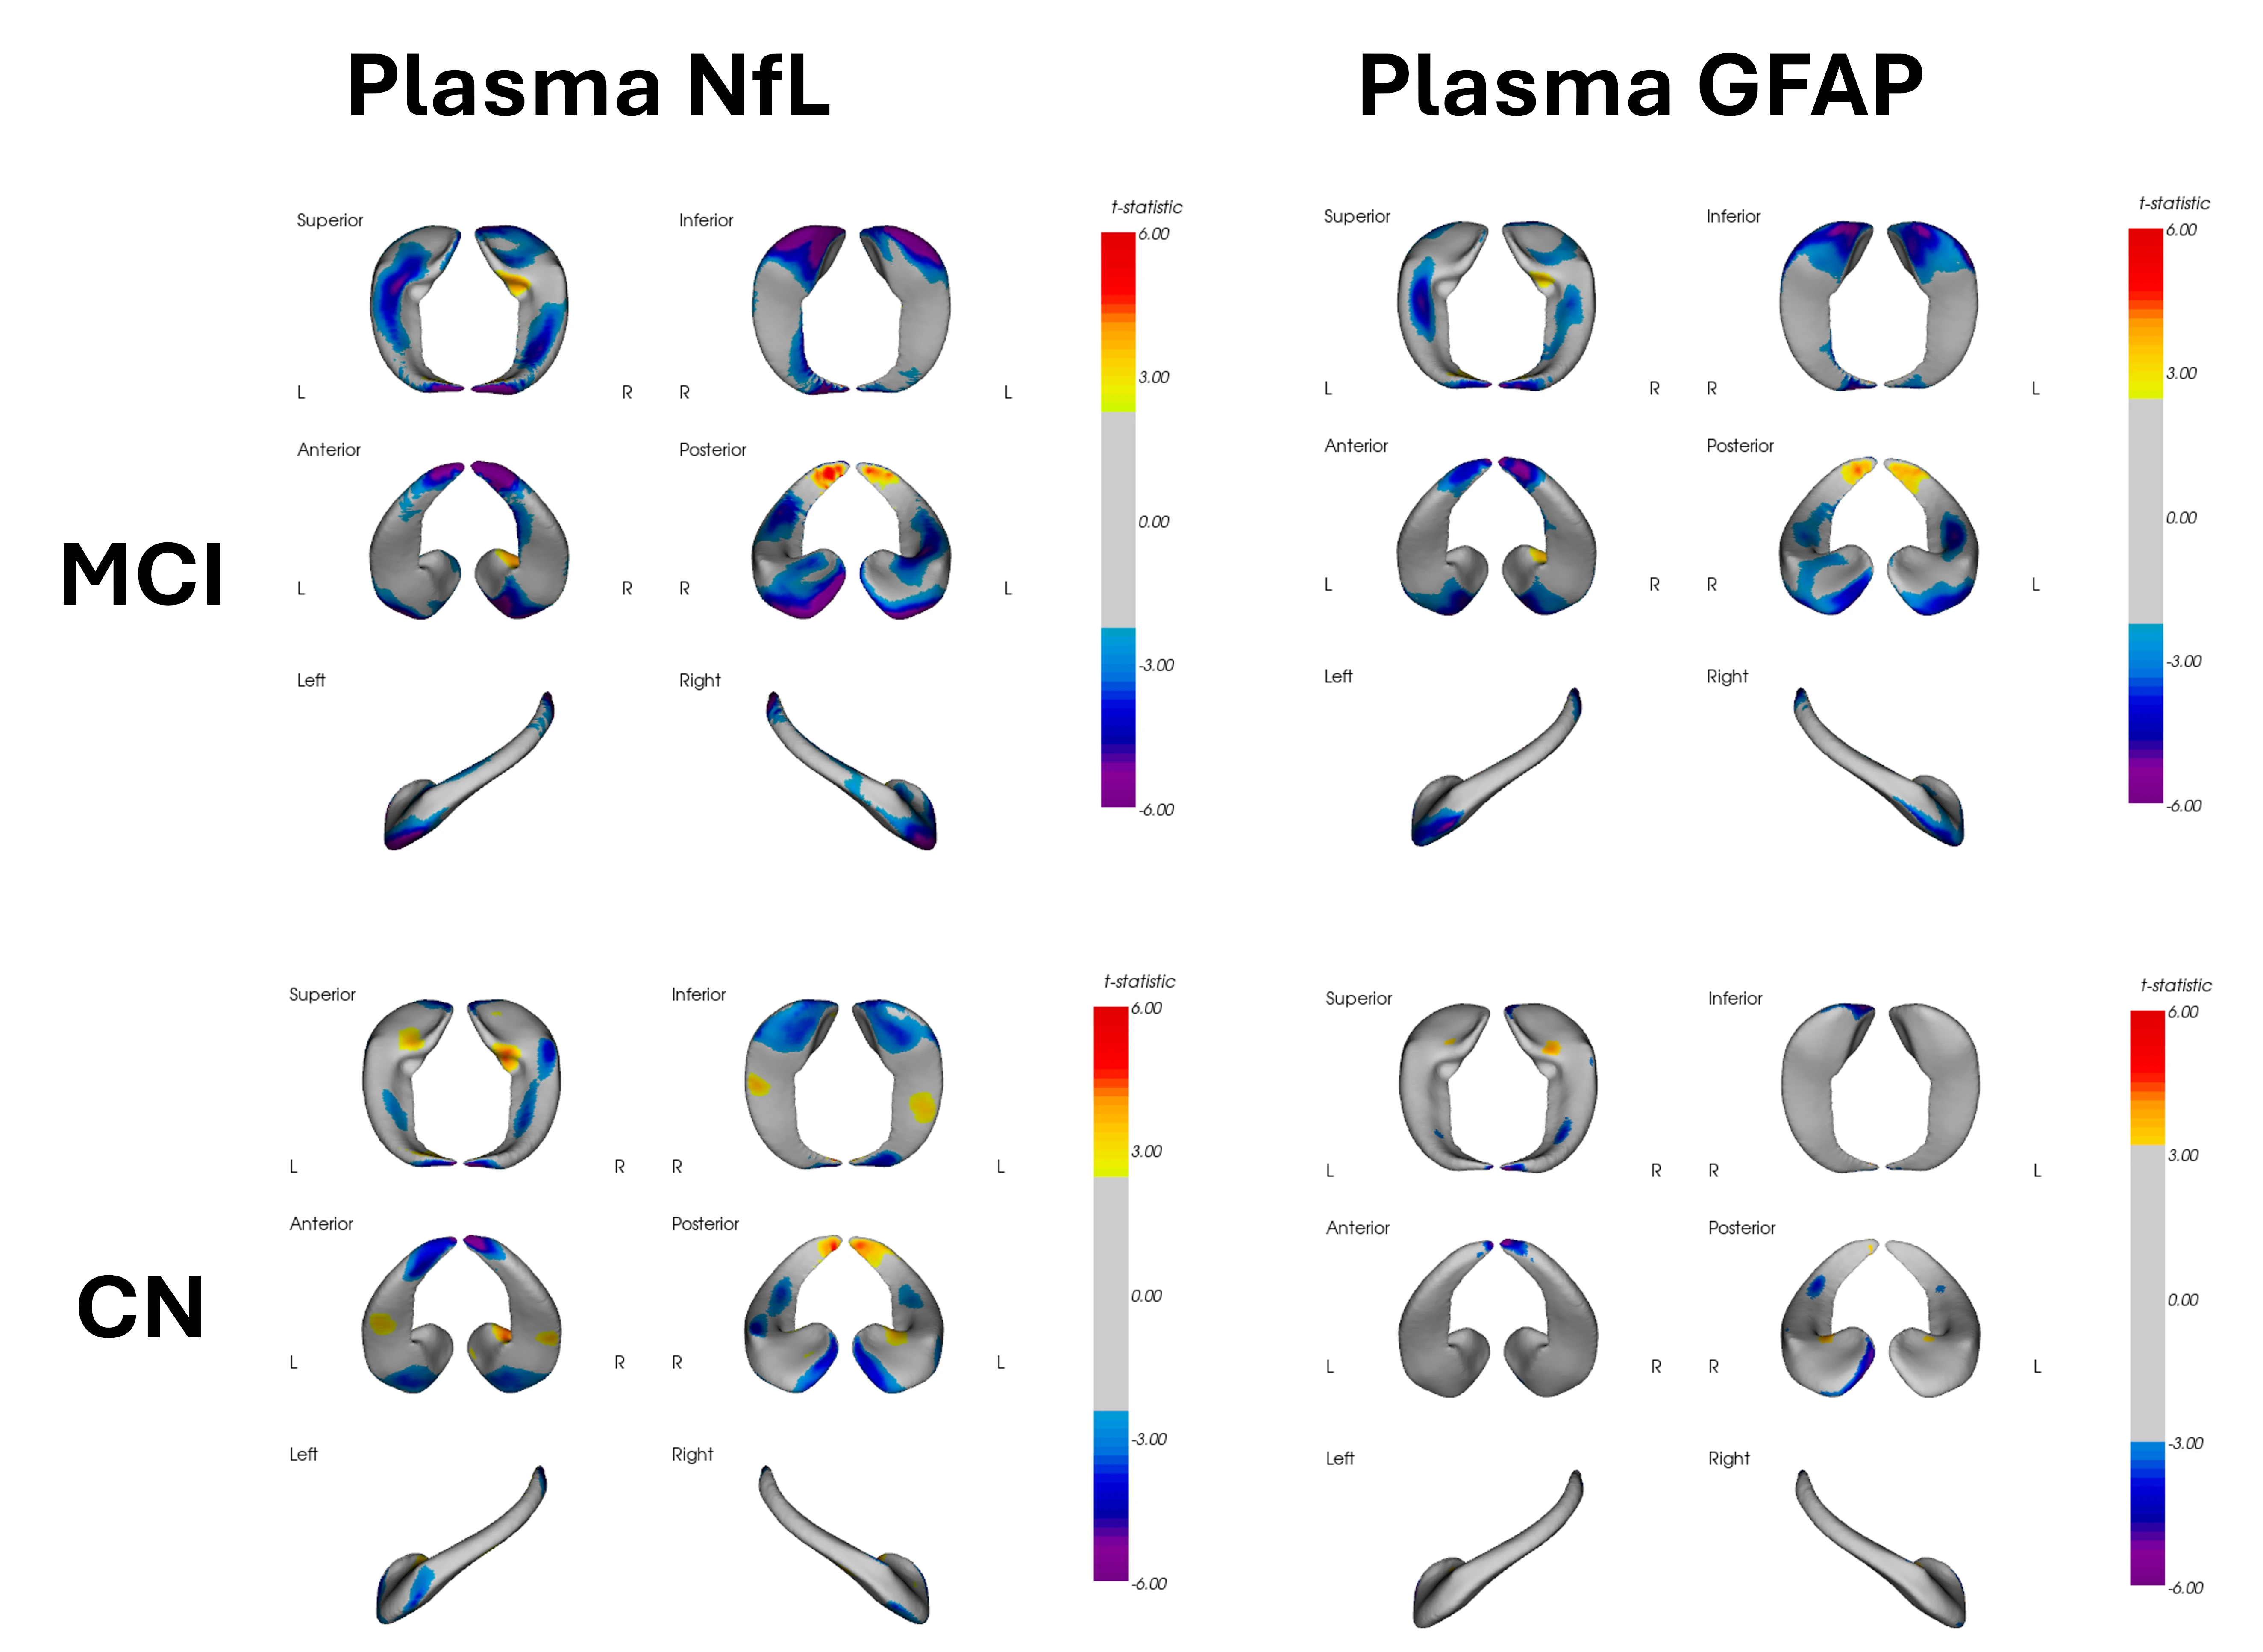
Association of the hippocampus surface deformations with plasma NfL and plasma GFAP biomarkers. For both biomarkers, the association appeared to be stronger in MCI subjects. For CN subjects, only plasma NfL showed significant areas of association with the hippocampus surface deformations.
A cross-sectional linear model was fitted to the hippocampus surface deformation data in CN and MCI subjects at baseline to assess its association with plasma neurofilament light chain (NfL) and plasma GFAP biomarkers. The set of covariates included age, sex, and APOEε4 genotype.
After multiple comparisons correction, the local shape deformations in several regions of the hippocampus had statistically significant associations with with both plasma NfL and plasma GFAP, although the strength and spatial extent appeared to be higher in MCI subjects. The negative sign in the significant associations means that the increase of the strength of the inward direction deformations in some regions of the hippocampus is correlated with the increase of both plasma NFL and GFAP levels. In other words, the hippocampus surface inward deformations are closely related to both axonal degeneration and astrogliosis.
Association of Hippocampus Surface Deformations with Plasma Ab42/Ab40 ratio and FDG Biomarkers
Association of Hippocampus Surface Deformations with Plasma Aβ42/Aβ40 Ratio & FDG PET Biomarkers
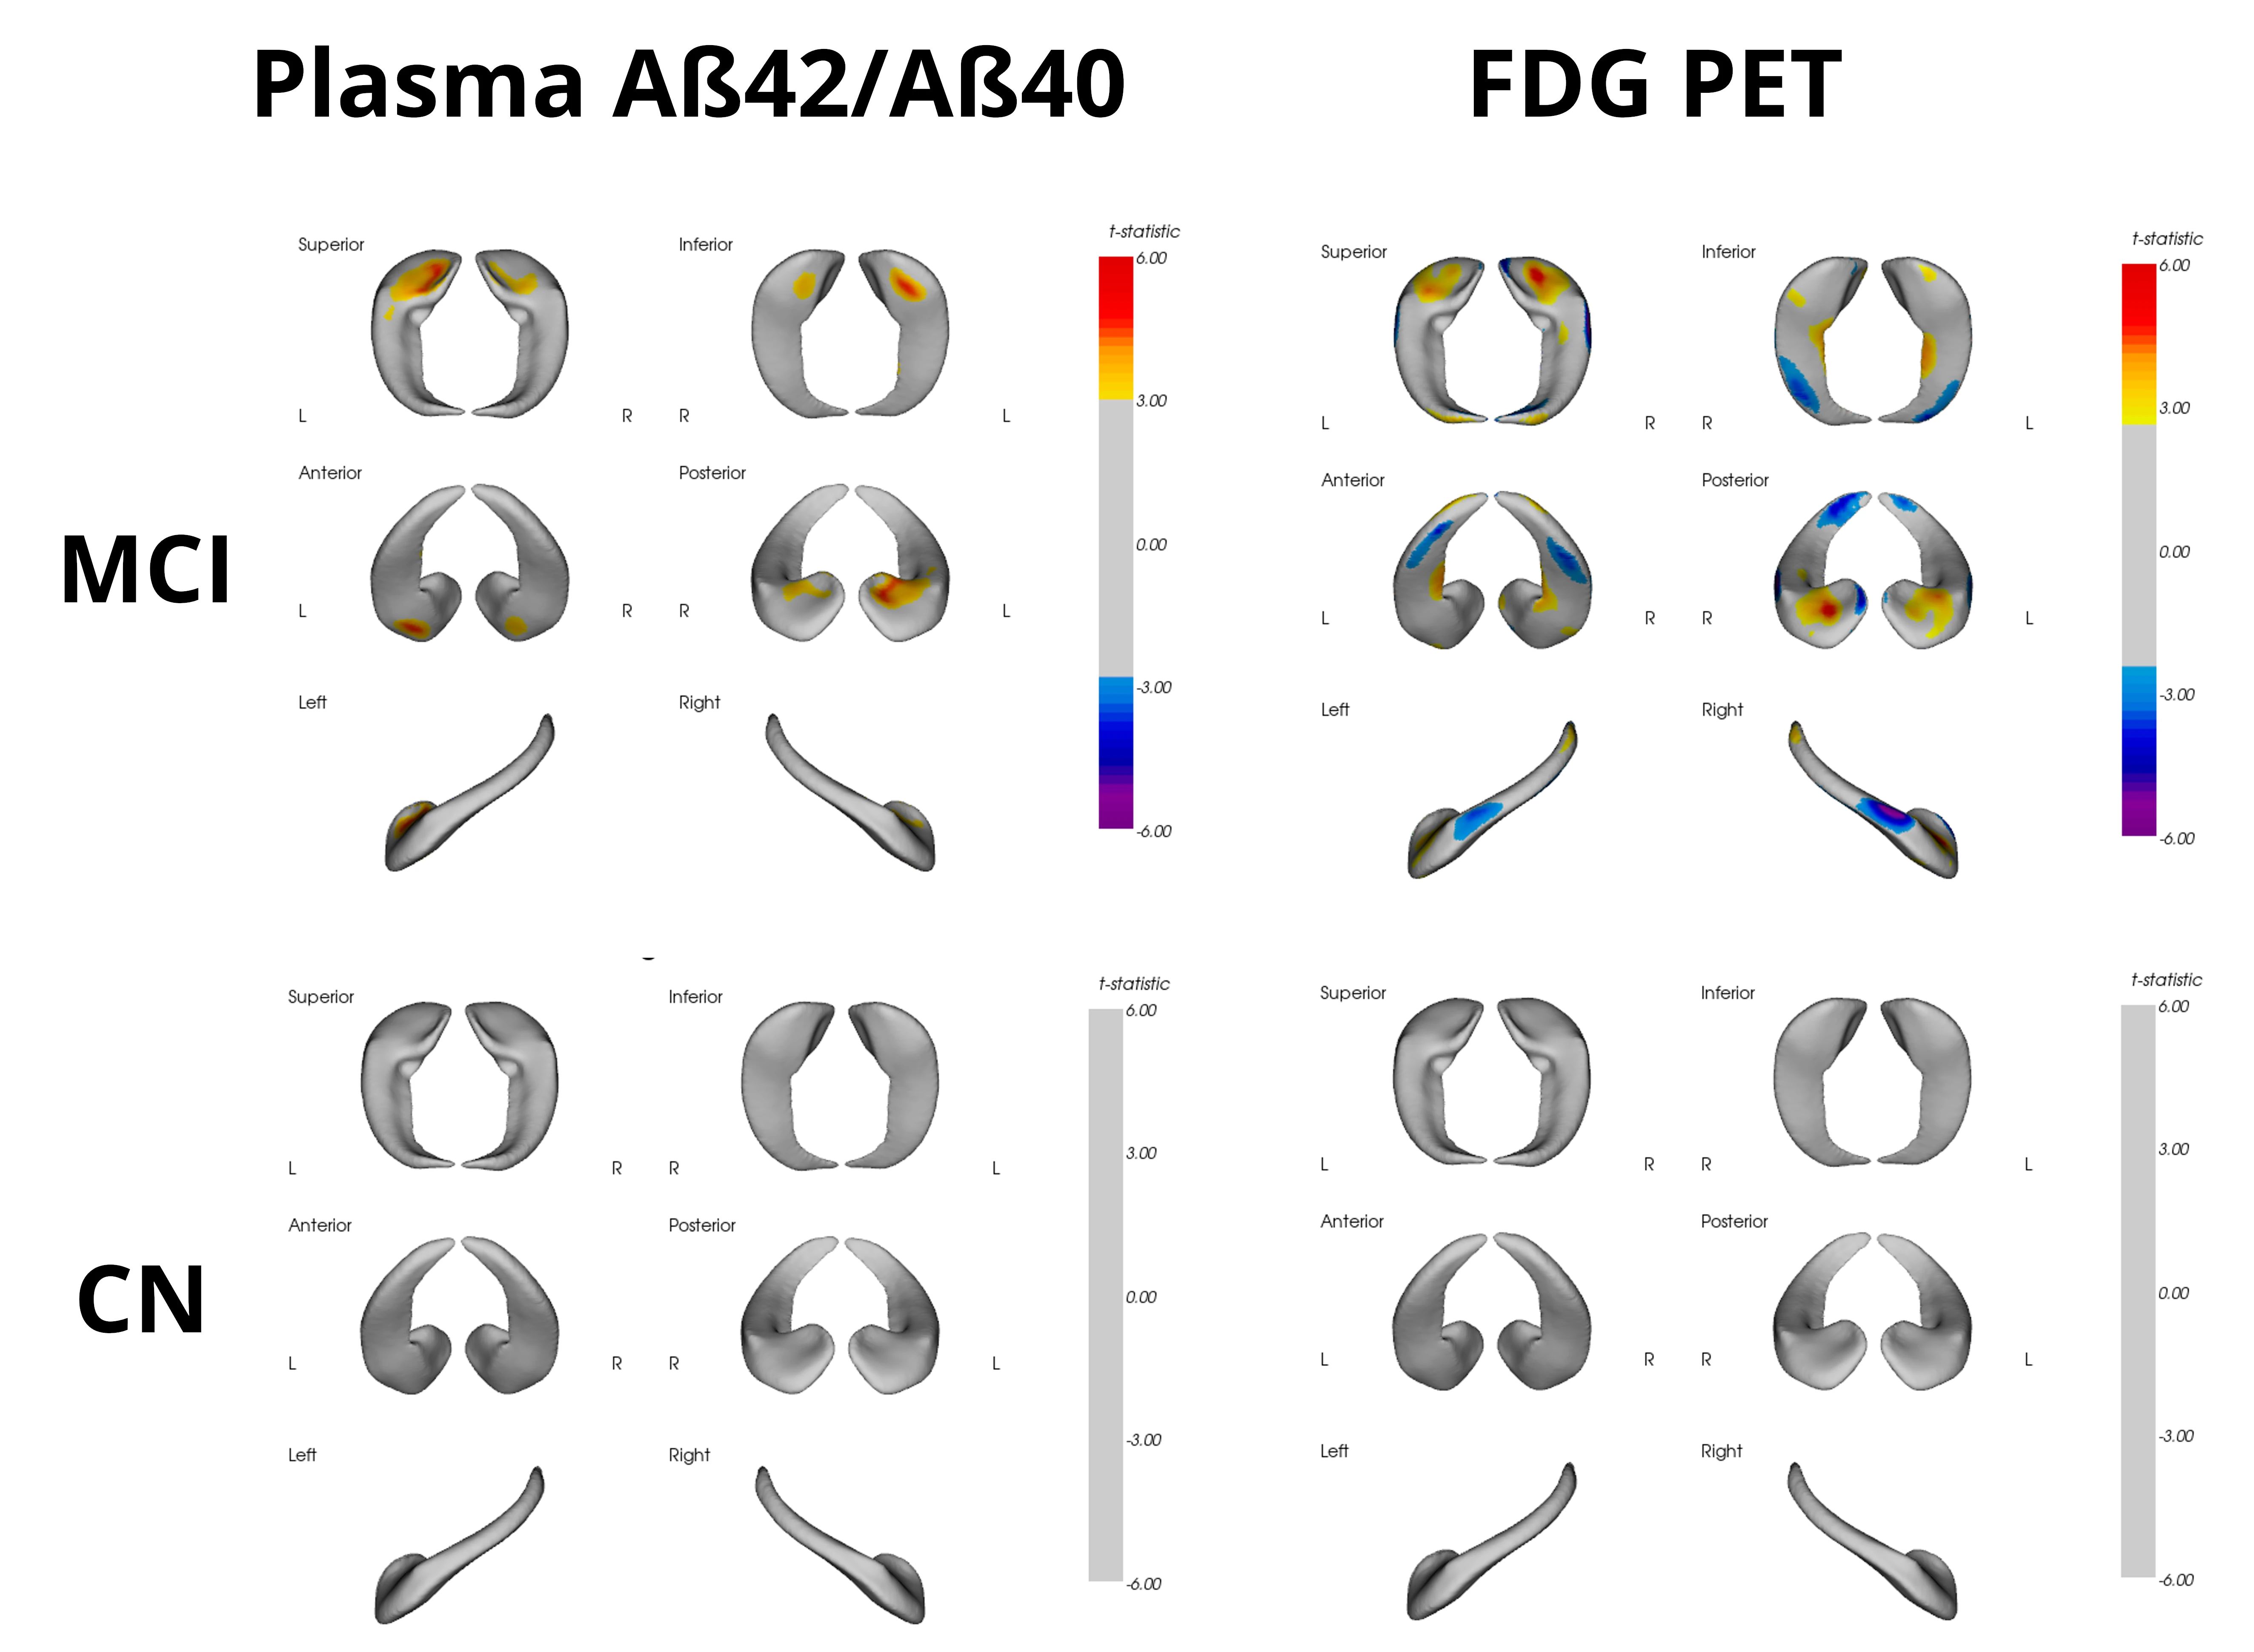
Association of the hippocampus surface deformations with both plasma Aβ42/Aβ40 ratio and FDG PET biomarkers. The FDG PET is derived from a metaROI that includes the lateral temporal, parietal, and medial parietal (posterior cingulate) cortices. For both biomarkers, there were statistically significant association in MCI subjects only.
A cross-sectional linear model was fitted to the hippocampus surface deformation data in CN and MCI subjects at baseline to assess its association with plasma Aβ42/Aβ40 ratio and FDG PET biomarkers. The set of covariates included age, sex, and APOEε4 genotype.
After multiple comparisons correction, the local shape deformations in several regions of the hippocampus had statistically significant associations with both plasma Aβ42/Aβ40 ratio and FDG PET in MCI subjects only. The positive sign in the significant associations means that the increase of the strength of the inward direction deformations in some regions of the hippocampus is correlated with the decrease of both plasma Aβ42/Aβ40 ratio and FDG PET SUVR levels. In other words, the hippocampus surface inward deformations in MCI are related with both Aβ plaque accumulation and cerebral glucose hypometabolism.
Accuracy of Tau PET SUVR Predictions
Accuracy of Tau PET SUVR Predictions
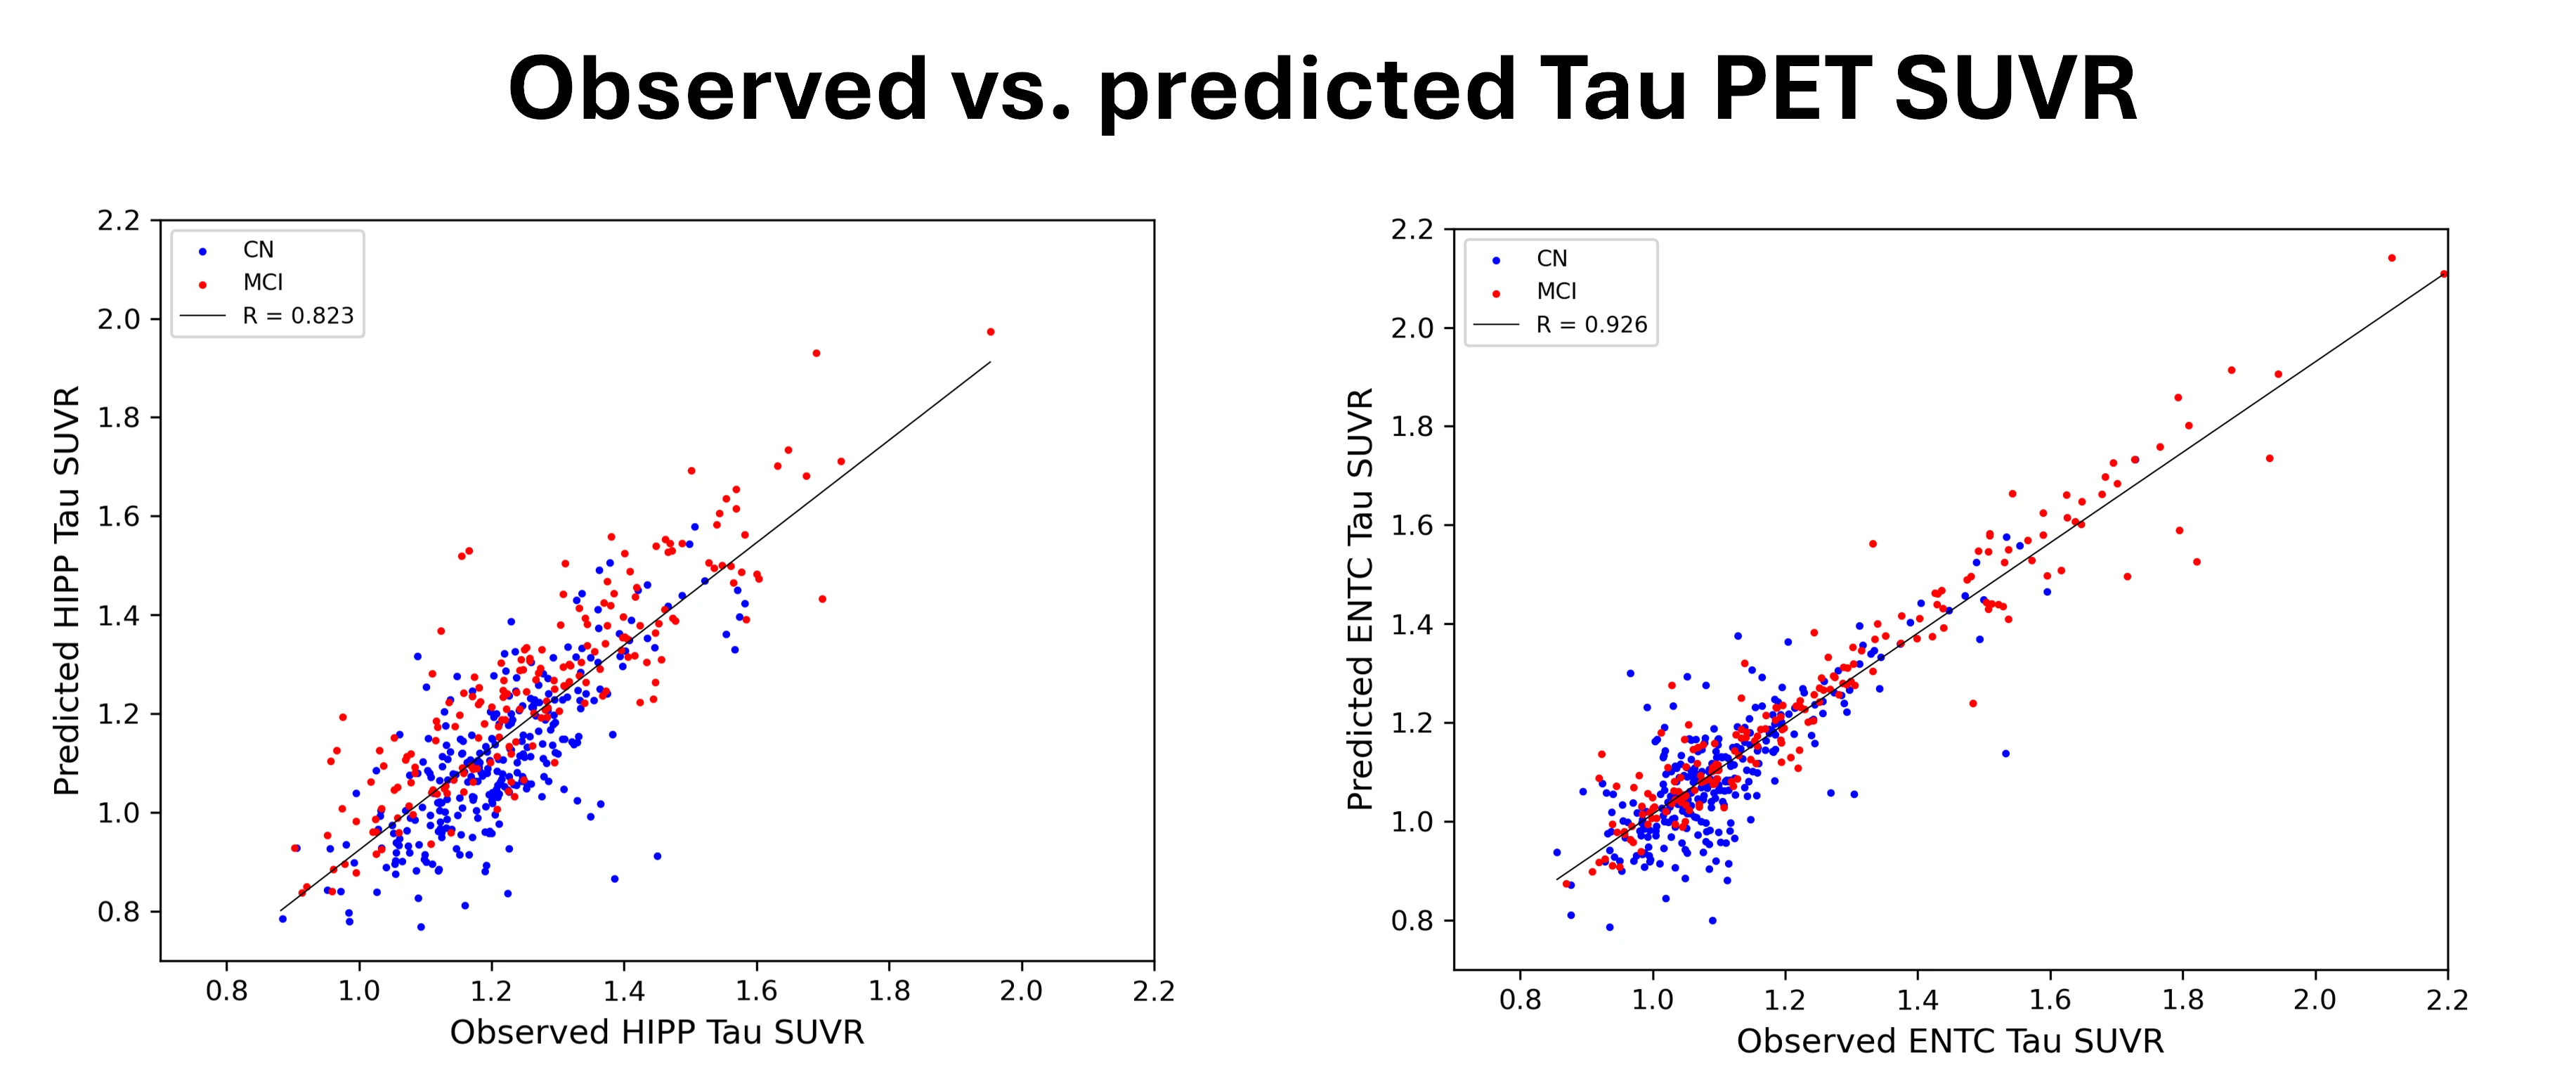
High correlation between the observed tau PET SUVR in the hippocampus/entorhinal cortex and the SUVR predicted from the hippocampus surface deformation maps.
A leave-one-out cross-validation analysis produced an optimal number of 220 Partial Least Squares (PLS) components with a squared cross-validated correlation coefficient (Q2) value of 0.74 for the prediction of Tau PET SUVR in the hippocampus itself, and 200 PLS components (Q2=0.81) for the prediction of Tau PET SUVR in the entorhinal cortex. In both cases, the predicted Tau SUVR PET values are highly correlated with the observed ones.
Longitudinal Analysis of Several Surface Deformations
Longitudinal Analysis of Several Surface Deformations
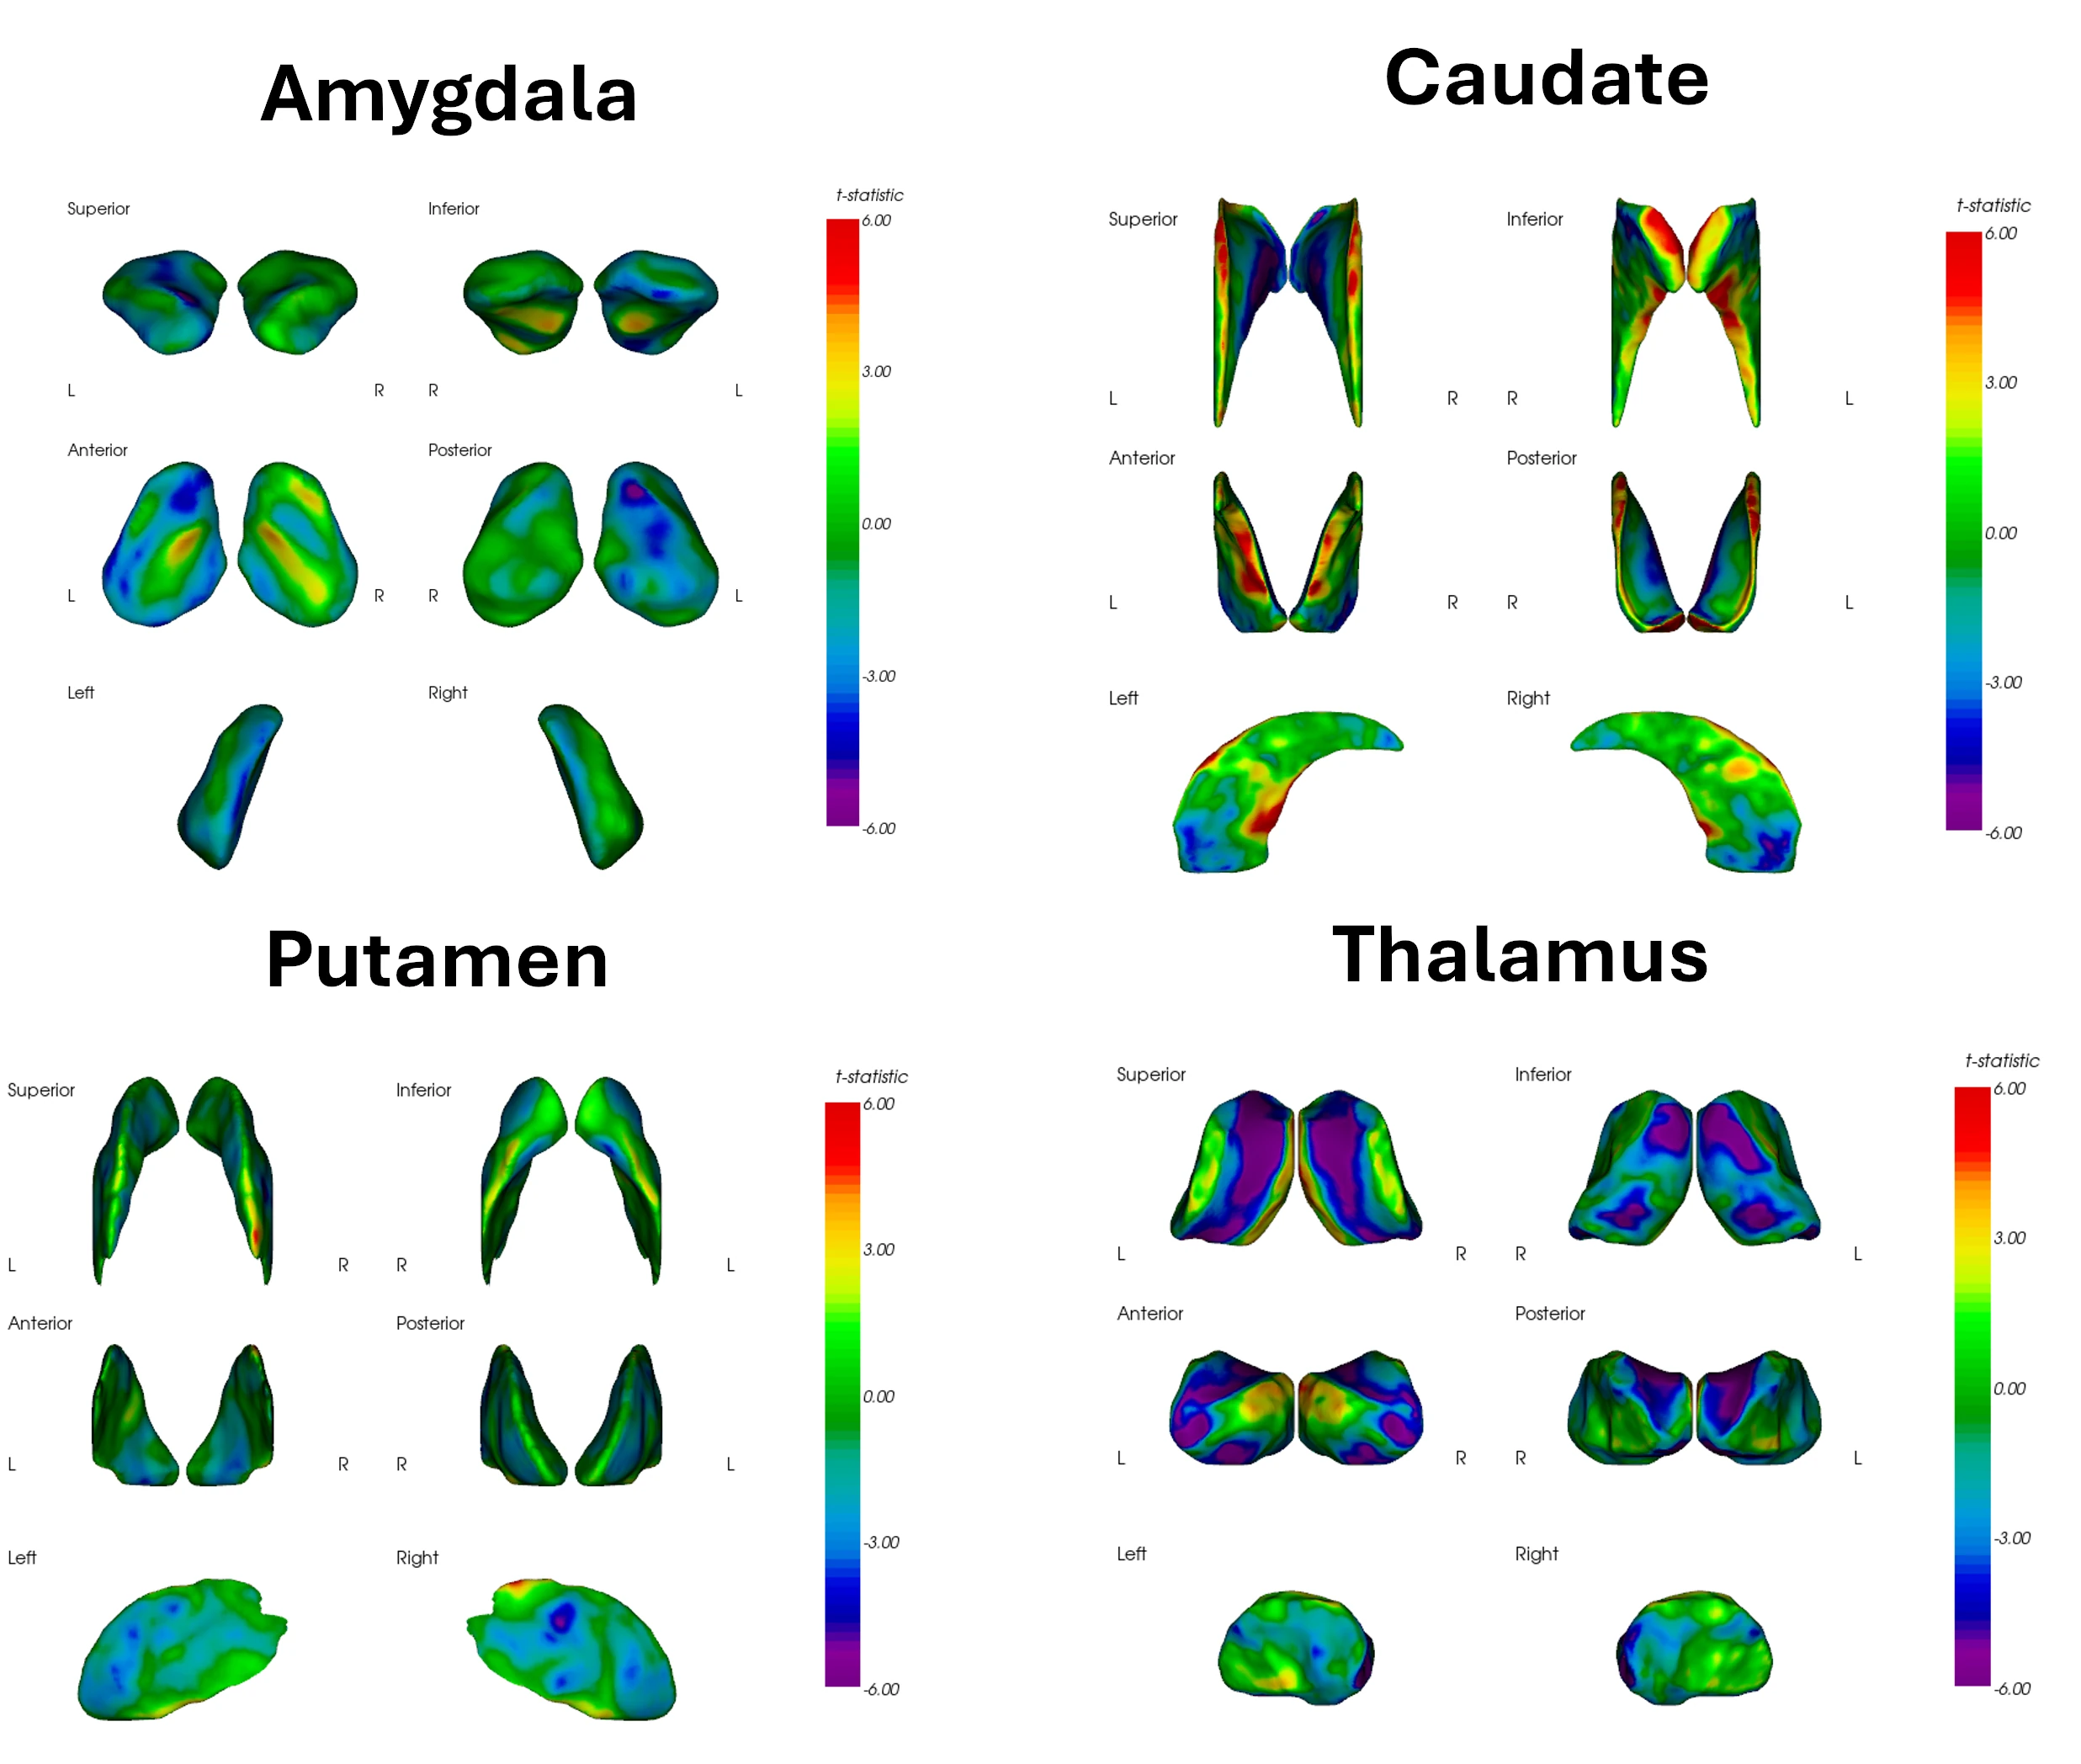
Spatial representation of the statistically significant changes in deformations of the Amygdala, Caudate, Putamen, and Thalamus after 24 months from the baseline visit for MCI subjects.
Very few to no statistically significant clusters were detected for the longitudinal effects of the amygdala and putamen surface deformations at 24 months in the MCI group. In contrast, the caudate and thalamus revealed large clusters of statistically significant changes in deformation. For the case of the caudate, the deformation changes occurred in both positive and negative signs, which is a typical example where local deformations occurred in both inward and outward directions along the surface normal, revealing subtle morphological changes that is probably not affecting the overall volume of the anatomical structure.
Association of Amygdala Surface Deformations with Tau PET SUVR
Association of Amygdala Surface Deformations with Tau PET SUVR
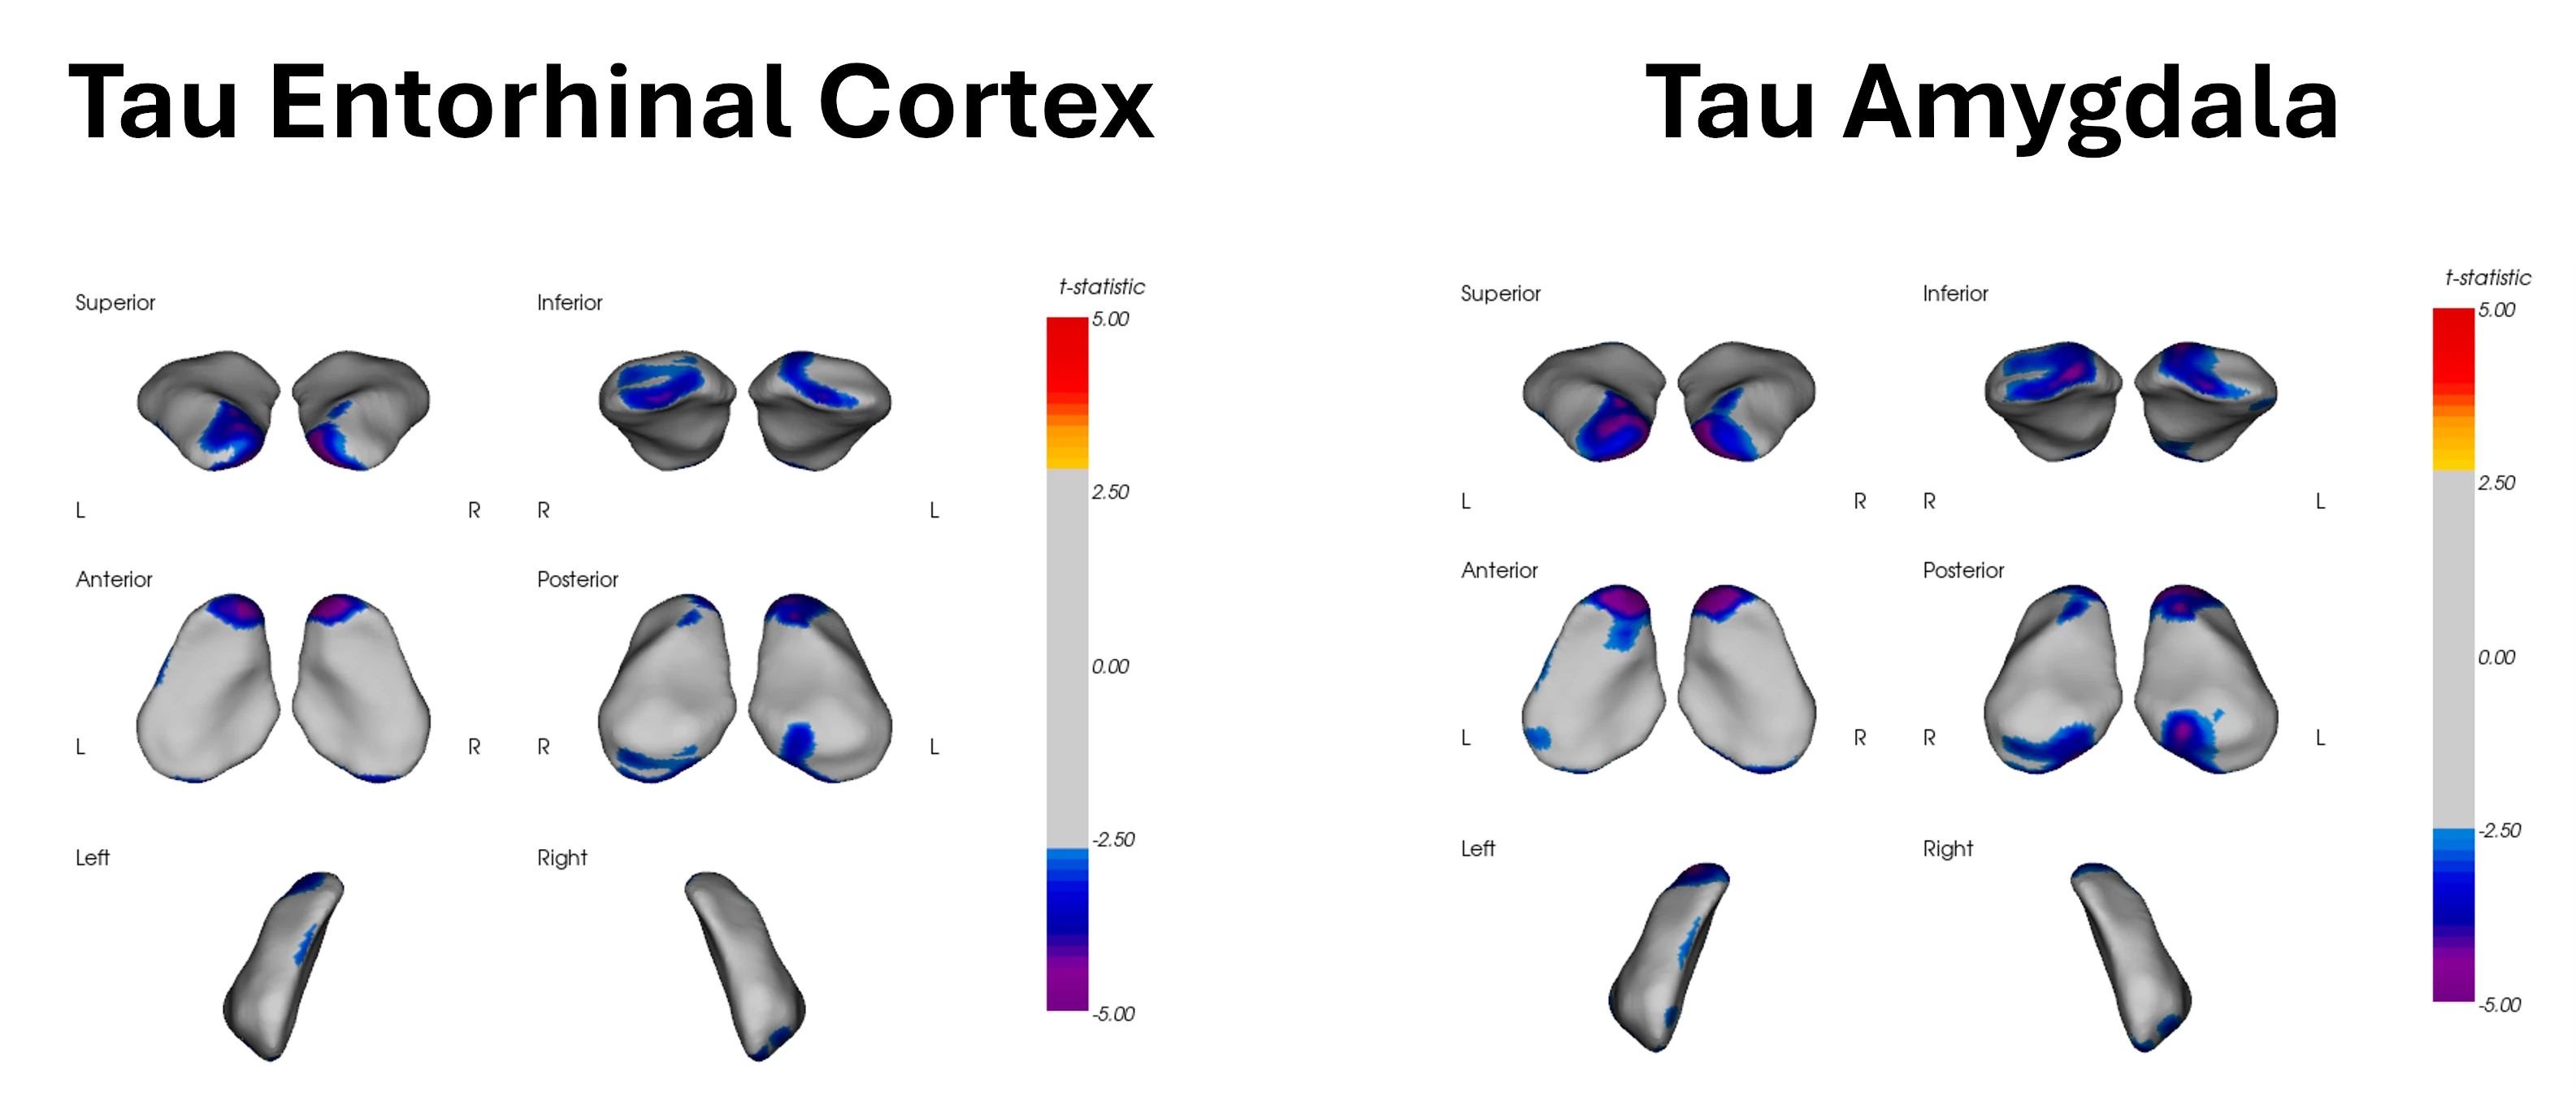
Association of the amygdala surface deformations with Tau PET SUVR of both the entorhinal cortex and the amygdala itself. The statistically significant association of the local deformations with both regions of Tau PET SUVR corresponded to the MCI group only.
A cross-sectional linear model was fitted to the amygdala surface deformation data in CN and MCI subjects at baseline to assess its association with Tau PET SUVR in both the entorhinal cortex and the amygdala itself. The set of covariates included age, sex, and APOEε4 genotype.
After multiple comparisons correction, the local shape deformations in several regions of the amygdala had statistically significant associations with Tau PET SUVR in both regions for the MCI group only. However, this association seems to be stronger and more spatially extended for the case of tau in the amygdala itself.
Association of Amygdala Surface Deformations with CSF ptau181 and Plasma GFAP Biomarkers
Association of Amygdala Surface Deformations with CSF pTau181 & Plasma GFAP Biomarkers
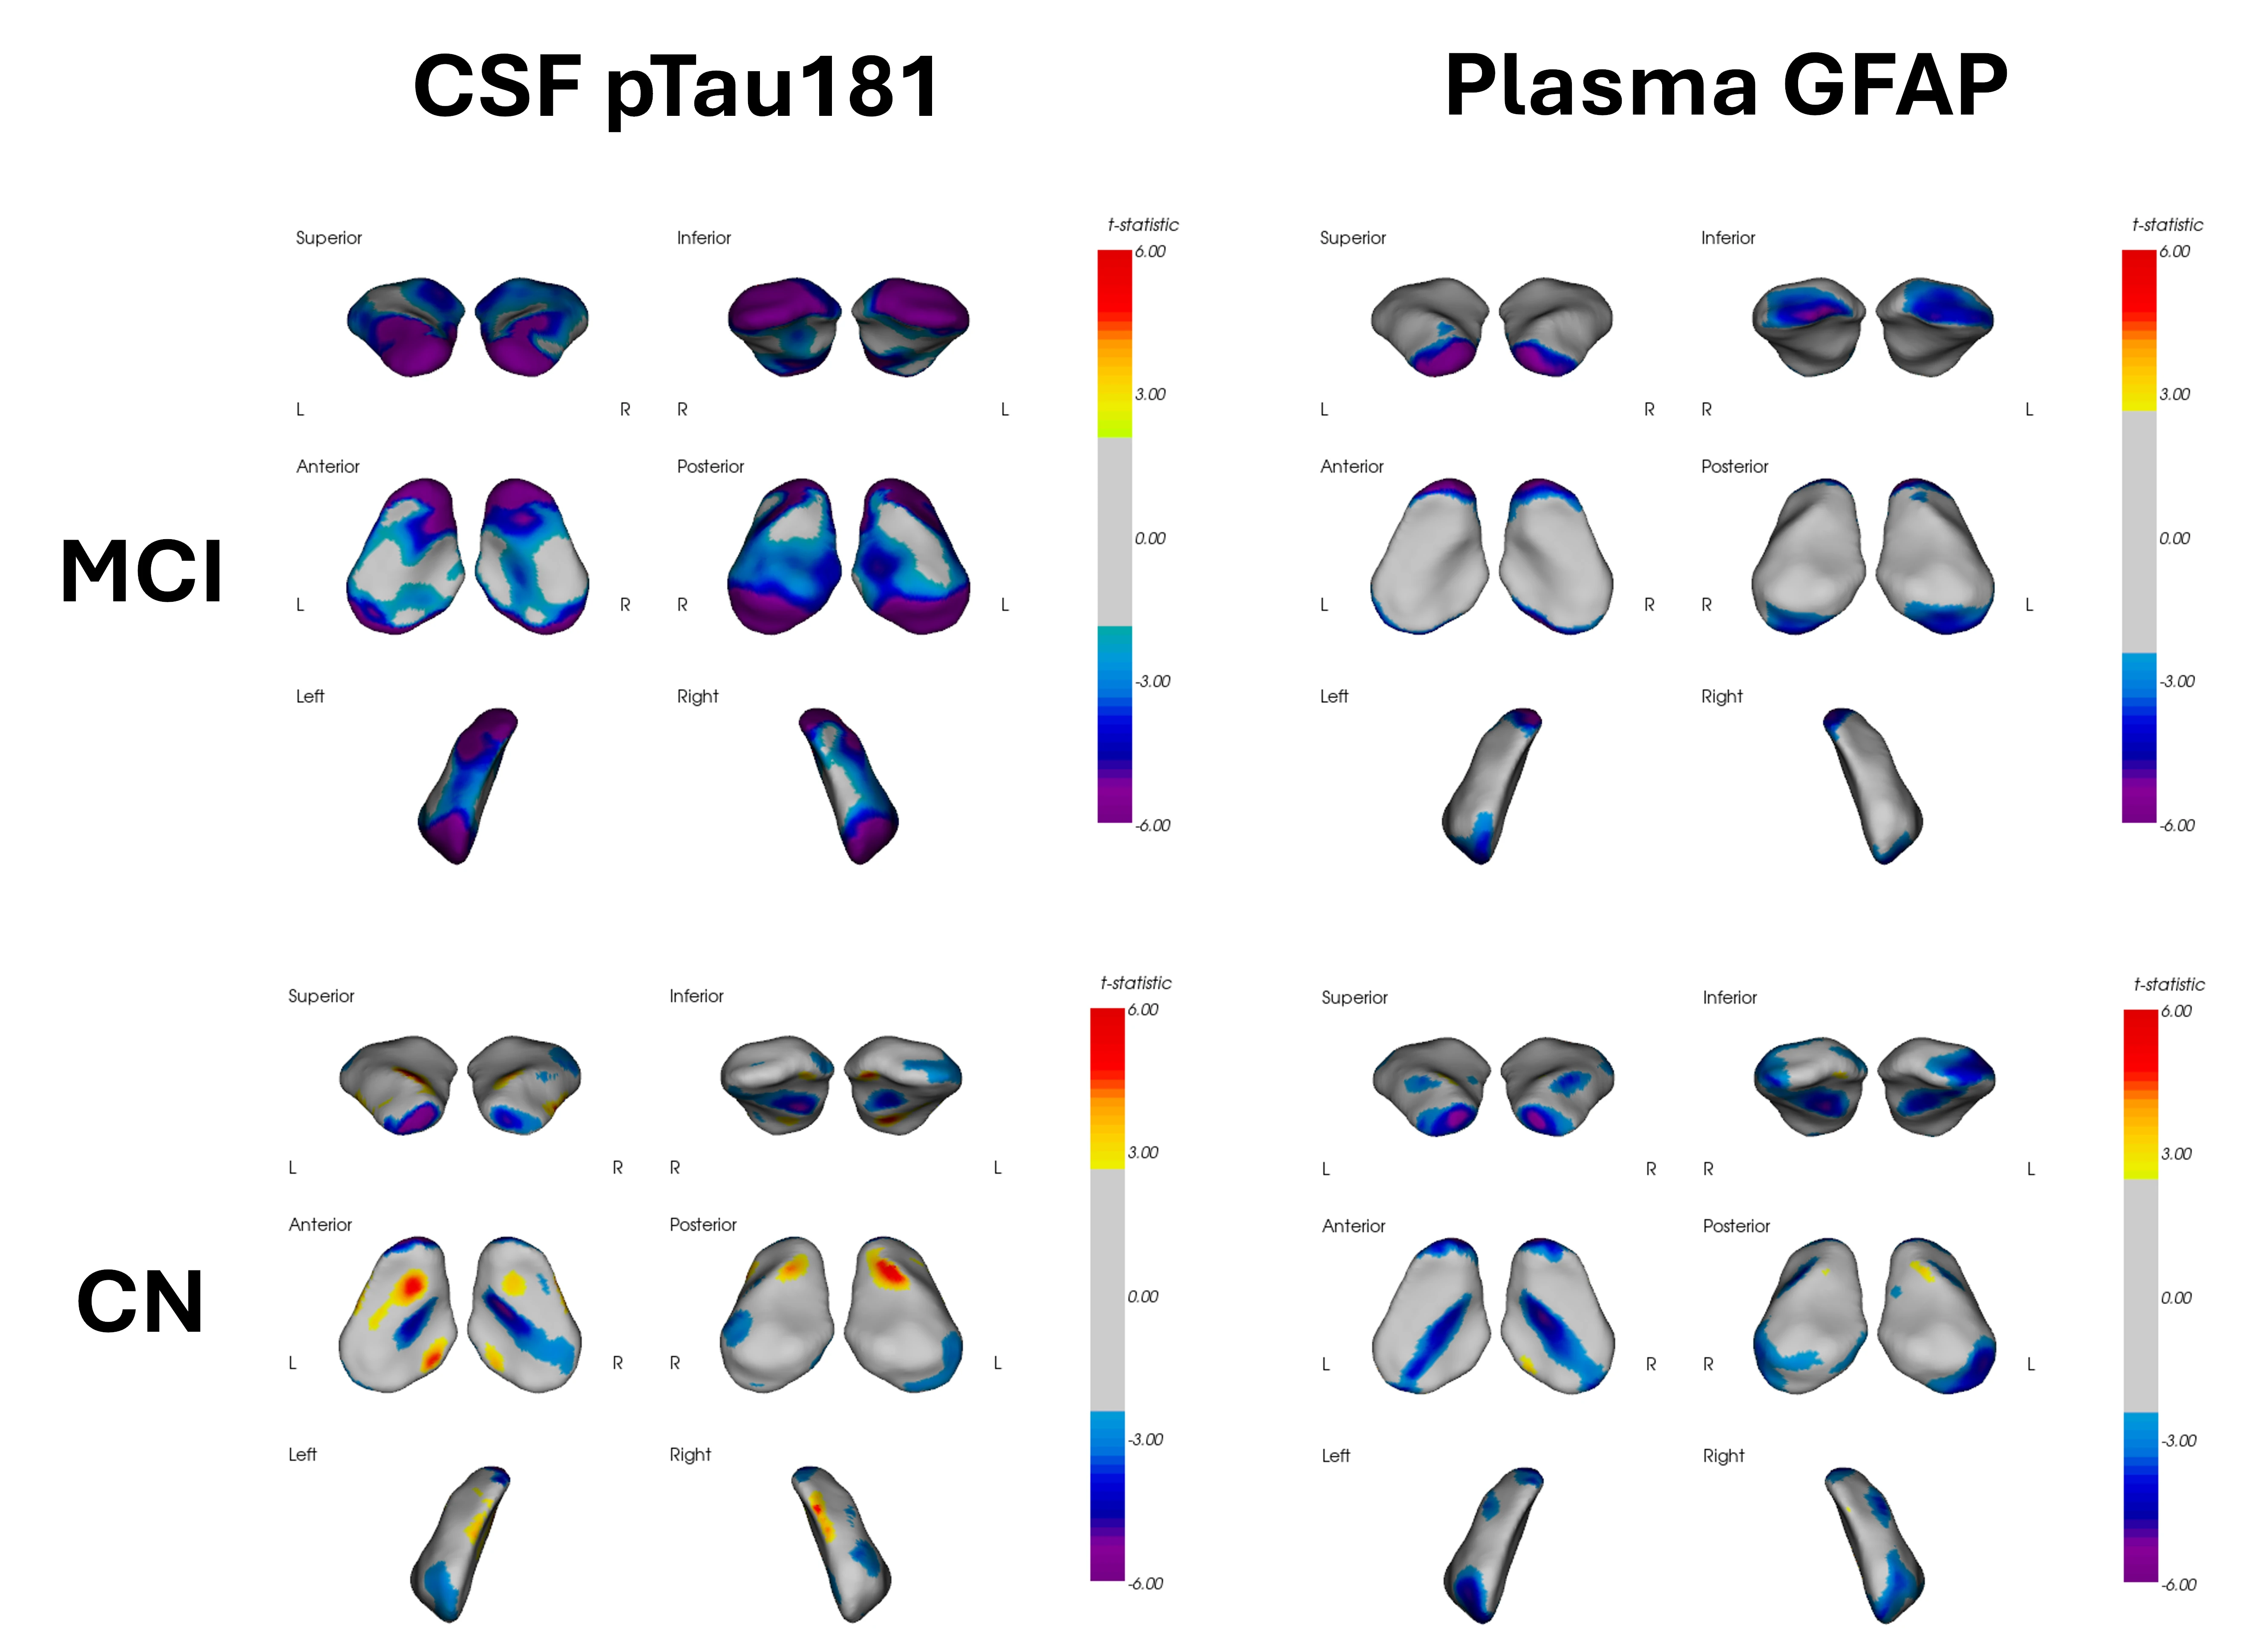
Association of the amygdala surface deformations with both CSF pTau181 and plasma GFAP. The strongest association of the local deformations with both fluid biomarkers corresponded to the MCI group.
A cross-sectional linear model was fitted to the amygdala surface deformation data in CN and MCI subjects at baseline to assess its association with CSF pTau181 and plasma GFAP biomarkers. The set of covariates included age, sex, and APOEε4 genotype.
After multiple comparisons correction, the local shape deformations in several regions of the amygdala had a statistically significant association with both CSF pTau181 and plasma GFAP, although the strength and spatial extension appeared to be higher in MCI subjects. However, in MCI, the amygdala surface deformations were more highly correlated with CSF pTau181 than with plasma GFAP, revealing a greater implication of the amygdala in the accumulation of Aβ plaques than with astrogliosis.
Association of Amygdala Volume with Both CSF ptau181 and Plasma GFAP
Association of Amygdala Volume with CSF pTau181 & Plasma GFAP
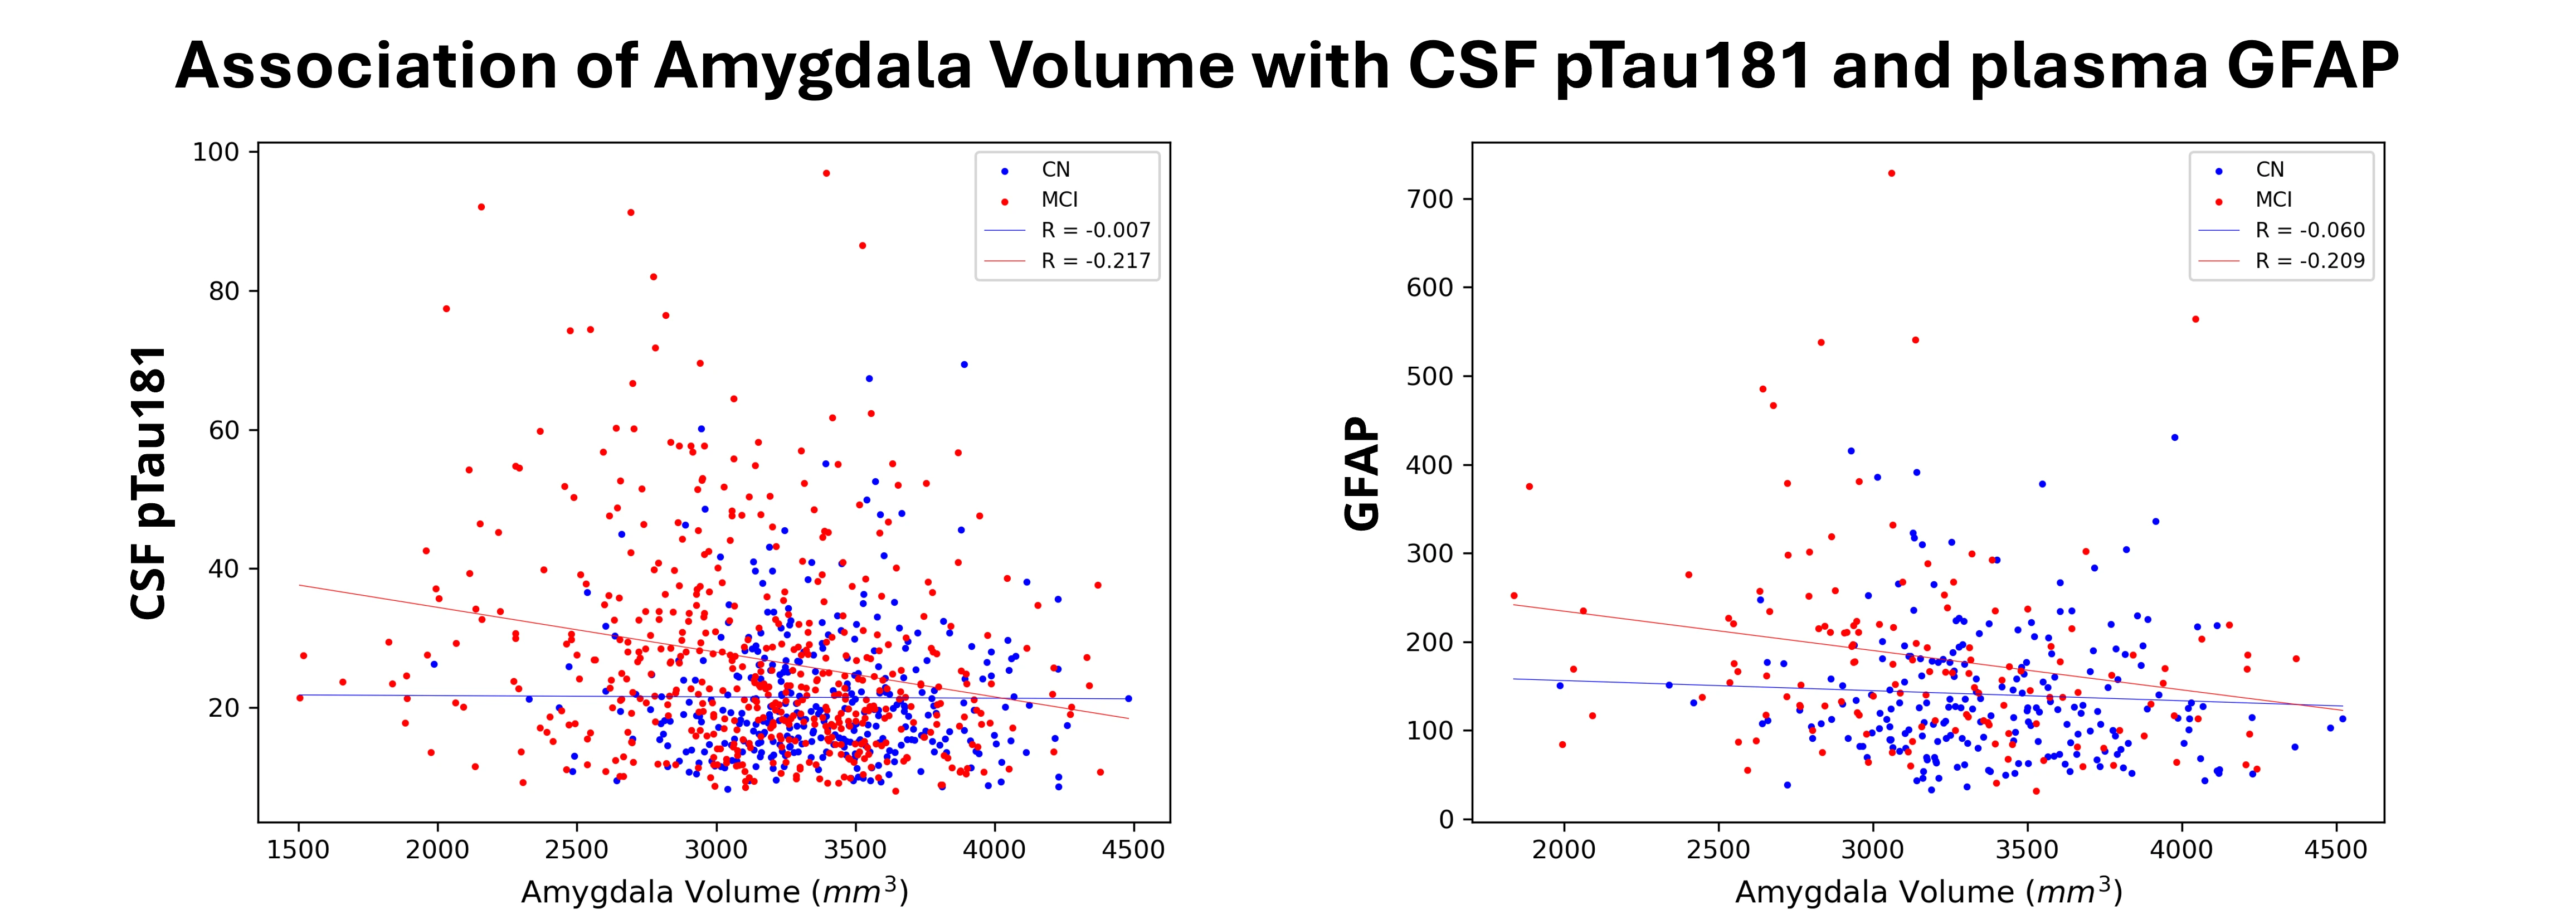
Association of the amygdala volume with both CSF pTau181 and plasma GFAP. Only a moderate correlation between the hippocampus volume for both fluid biomarkers in MCI subjects but no significant correlation in CN subjects.
A Pearson’s correlation analysis was computed between the amygdala volume and both CSF pTau181 and plasma GFAP for CN and MCI subjects.
For MCI subjects, we obtained a moderate correlation between the amygdala volume and each of the two fluid biomarkers. However, no significant correlations were found for the case of cognitively normal subjects. As compared with our data on the previous slide, this finding illustrates that the amygdala surface deformations might be more sensitive than volume for revealing associations of the hippocampus shape with both CSF pTau181 and plasma GFAP in cognitively normal and MCI subjects.
Summary
Summary
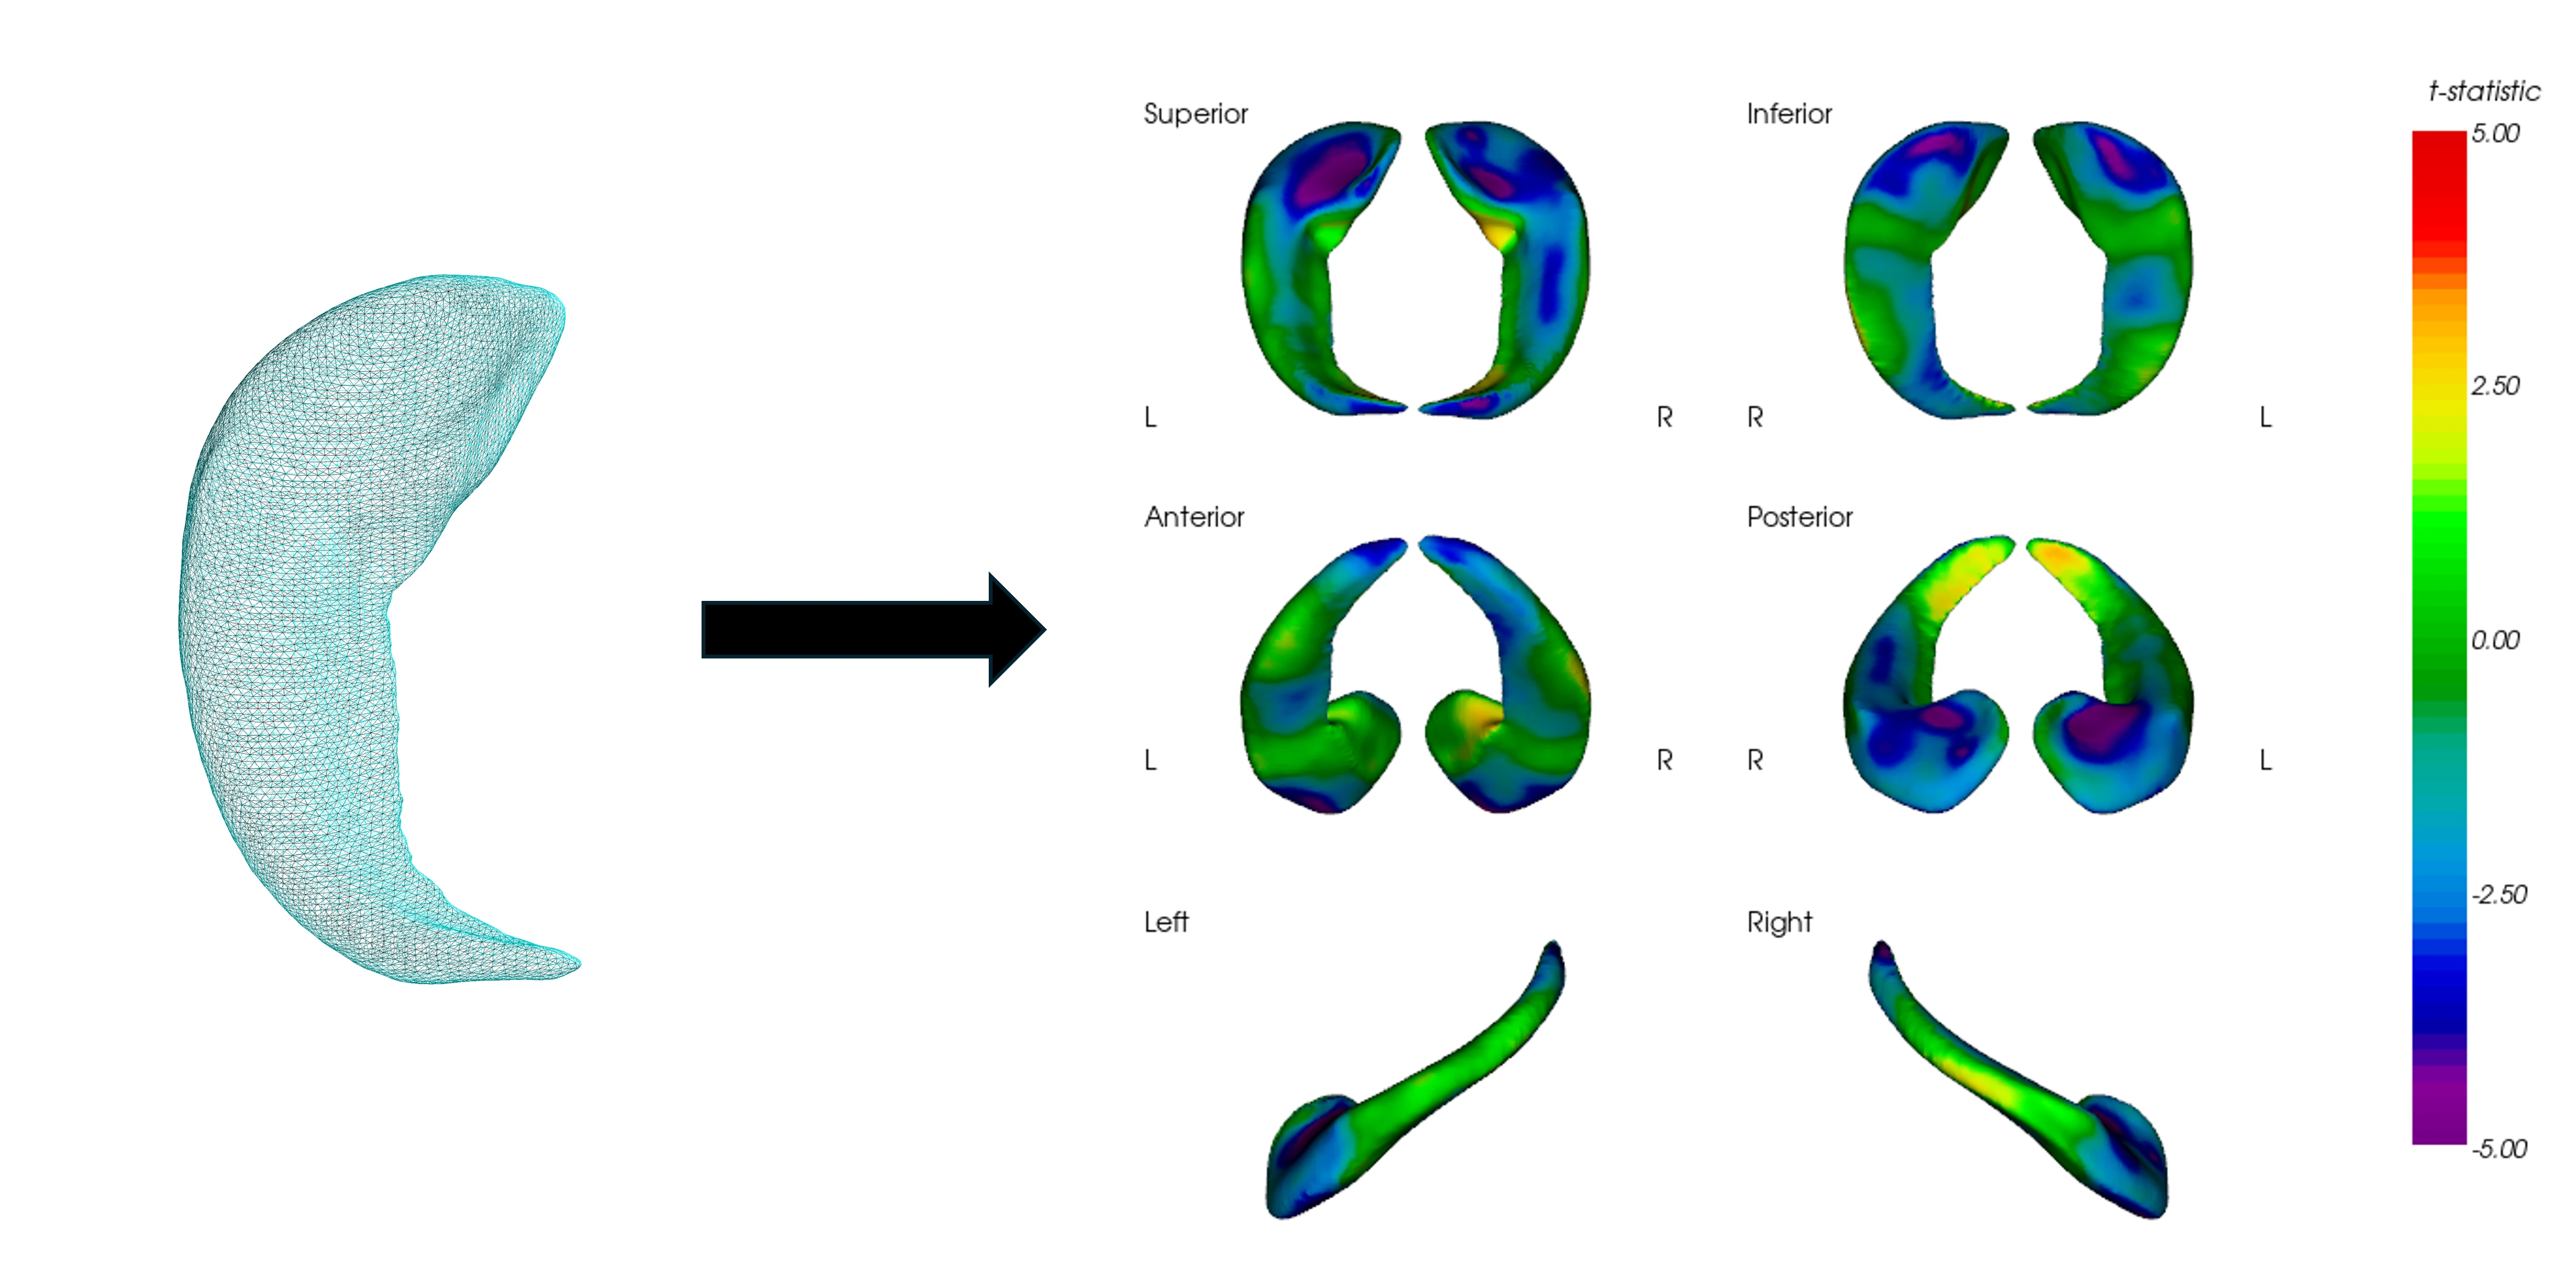
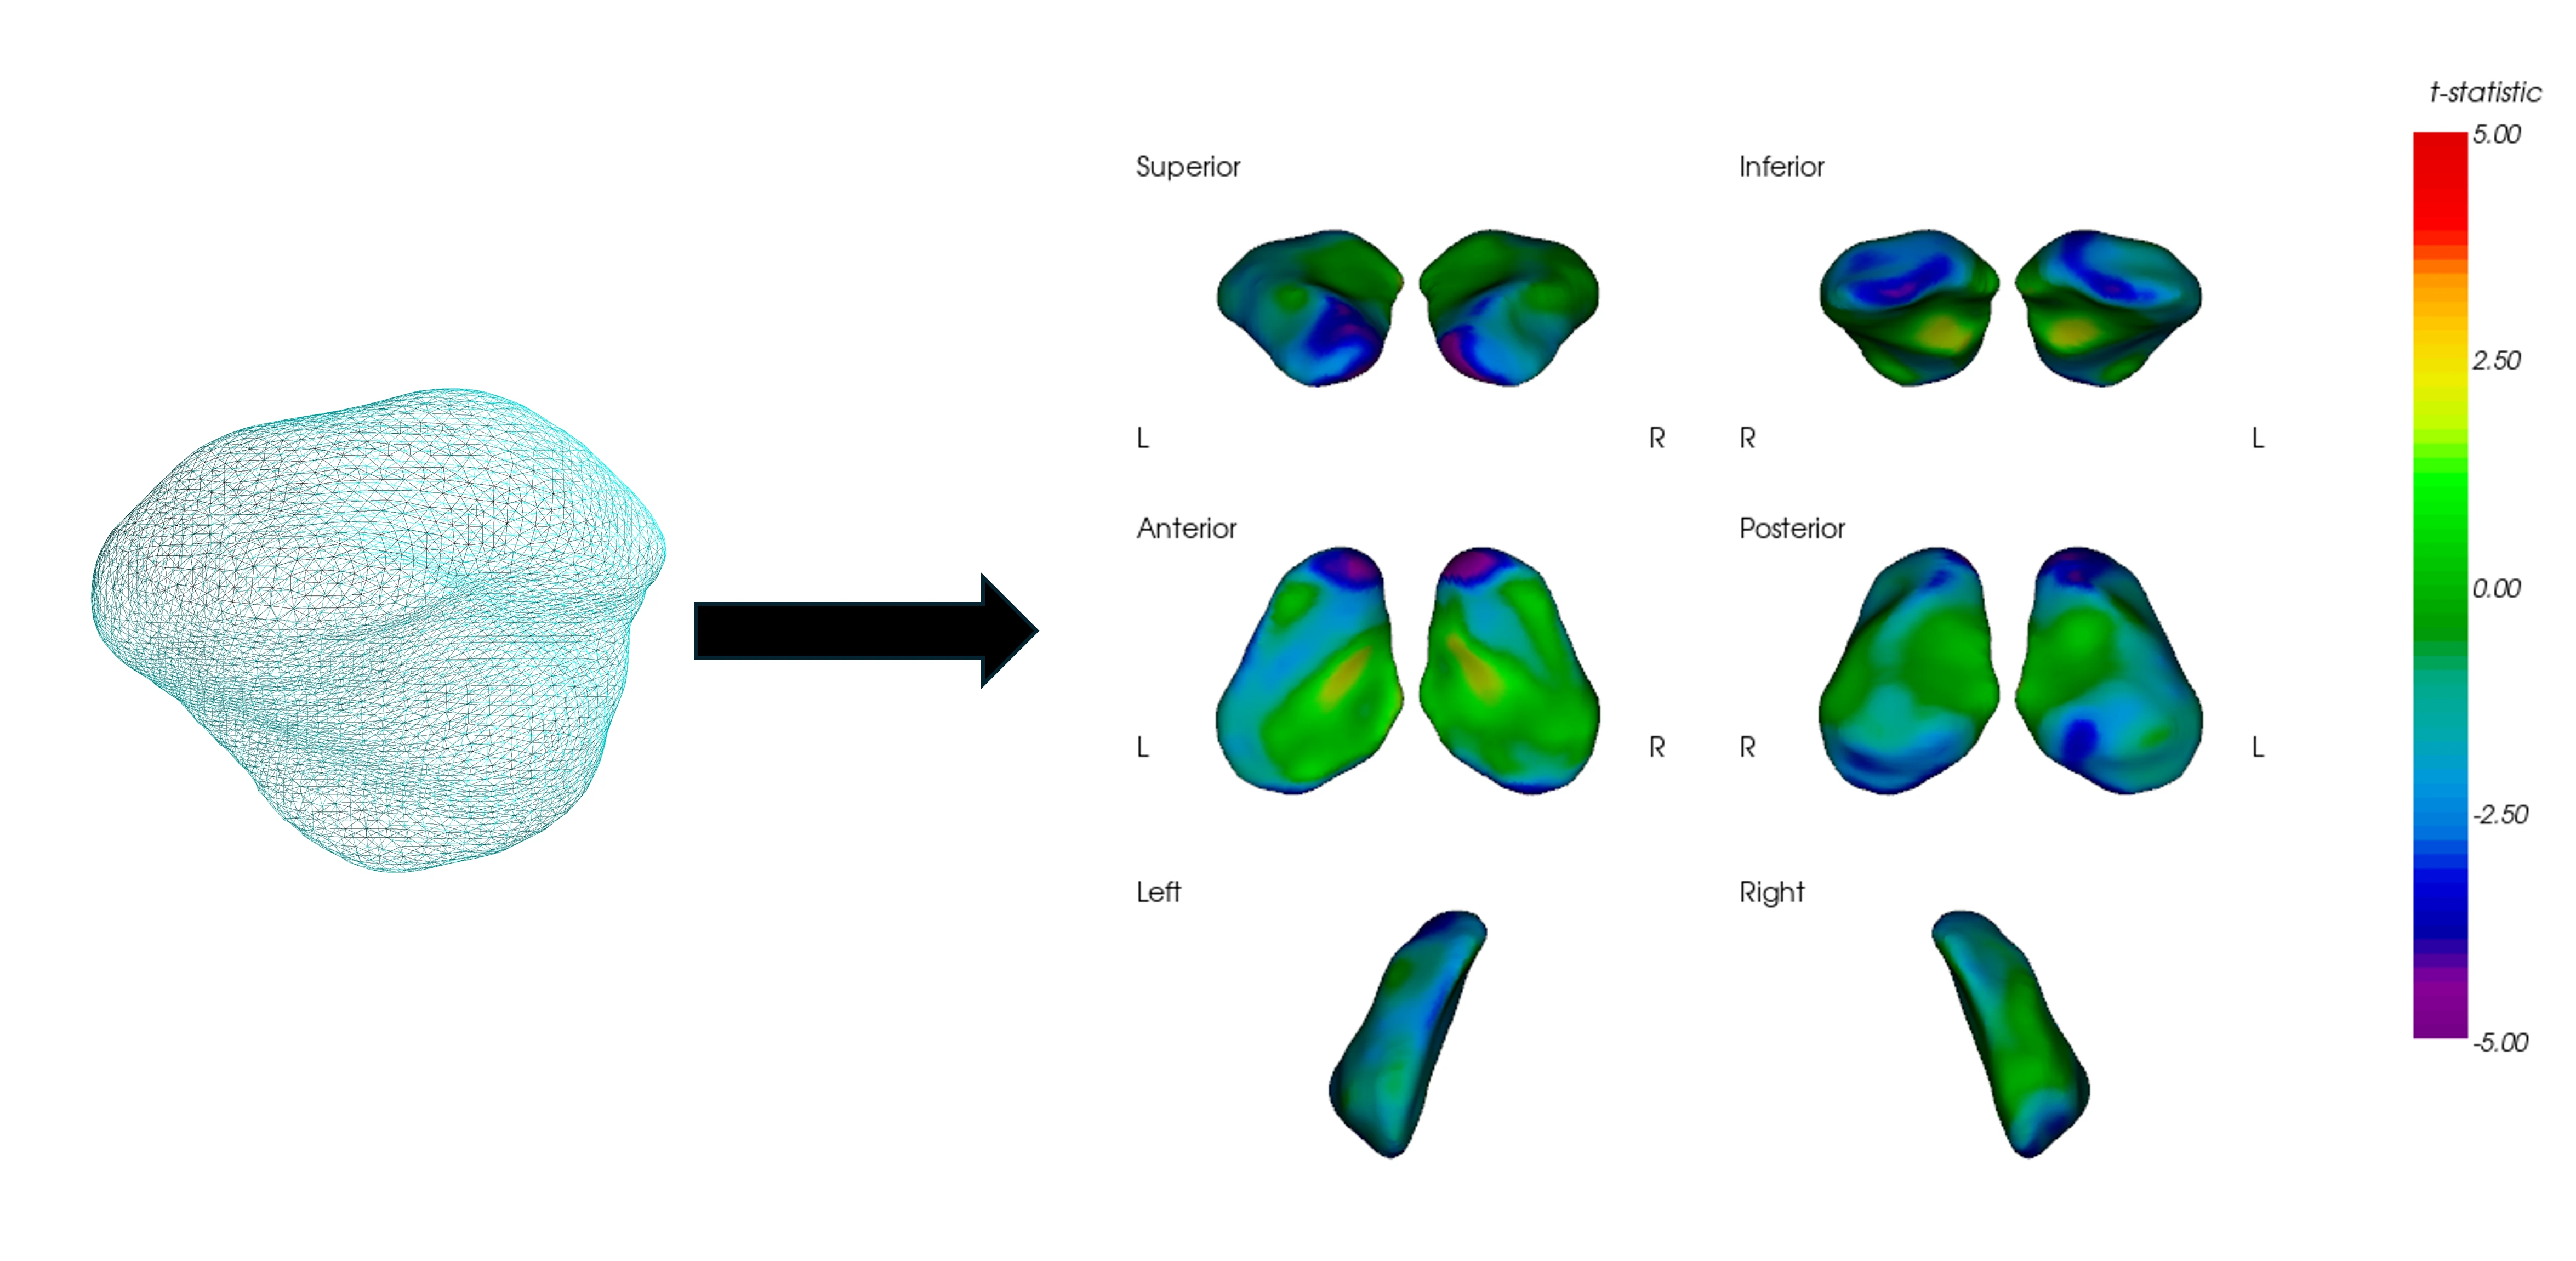
We examined the feasibility of the local deformations on the surface of subcortical structures (i.e. “shape analysis”) as an alternative biomarker to the traditional volumetric metrics for the diagnosis and tracking progression of Alzheimer’s’ disease.
Our key findings:
Local deformations in the shape of subcortical structures, such as the hippocampus, is a sensitive biomarker for tracking the progression of atrophy in MCI.
Surface-based deformations in the hippocampus and the amygdala are highly correlated with other imaging and fluid biomarkers of Alzheimer’s disease.
Surface-based deformations in the hippocampus can be used as accurate predictors of Tau PET SUVR in Cognitively Normal and MCI subjects.
By accurately identifying subcortical regions with significant morphological changes, our approach enhances our ability to track disease progression and evaluate therapeutic interventions. Our predictive models will allow us to use anatomical T1-weighted MRI data as a surrogate for Tau PET SUVR for eligibility screening in clinical trials of disease-modifying therapeutics.
1/17
Data Sources
Data used in the preparation of this article were obtained from the ADNI database (http://adni.loni.usc.edu). The ADNI was launched in 2003 by the National Institute on Aging (NIA), the National Institute of Biomedical Imaging and Bioengineering (NIBIB), the Food and Drug Administration (FDA), private pharmaceutical companies, and non-profit organizations, as a $60 million, 5-year public-private partnership, which has since been extended. ADNI is the result of the efforts of many co-investigators from a broad range of academic institutions and private corporations, and subjects have been recruited from over 55 sites across the U.S. and Canada. To date, the ADNI, AND-GO, ADNI-2, ADNI-3 and ADNI-4 protocols have recruited over 2,500 adults, ages 55 to 90, to participate in the research, consisting of cognitively normal (CN) older individuals, people with early or late Mild Cognitive Impairment (MCI), and people with dementia due to AD. For up-to-date information, see www.adni-info.org.
Keywords
Aβ42/Aβ40 Ratio: a biomarker ratio used to assess amyloid pathology and Alzheimer’s disease risk.
Alzheimer’s Disease (AD): a neurodegenerative disorder marked by cognitive decline, hippocampal atrophy, and amyloid‑β and tau pathology.
Alzheimer’s Disease Biomarkers: measurable biological or imaging indicators that help detect, track, or predict Alzheimer’s disease and its progression.
Atrophy: a reduction in tissue size or volume, often caused by cell loss or degeneration.
Biomarker: a measurable indicator of a biological state or condition. Biomarkers are often used in medicine and research to detect or monitor the presence, progress, or severity of a disease, as well as to assess the effectiveness of a treatment.
FDG: a PET imaging marker of glucose metabolism in the brain, often used as an indicator of neuronal activity or hypometabolism.
GFAP: Glial Fibrillary Acidic Protein, a biomarker associated with astrocyte activation and neuroinflammation.
Mild Cognitive Impairment (MCI): an early cognitive decline state that may precede Alzheimer’s disease while daily function remains intact.
MRI-based Biomarkers: quantitative indicators derived from MRI scans that provide evidence of structural brain change linked to disease.
NfL: Neurofilament Light Chain, a biomarker of axonal injury and neurodegeneration.
pTau181: a phosphorylated tau biomarker associated with Alzheimer’s disease pathology, measurable in CSF or plasma.
Surface-Based Morphology: markers derived from the shape and local surface structure of brain regions, used to detect subtle anatomical changes that may not appear in standard volume measures.
Subcortical Surface Deformation: a shape analysis method that quantifies local inward or outward changes on the surfaces of subcortical brain structures, such as the hippocampus, amygdala, thalamus, caudate, and putamen.
Tau PET SUVR: a quantitative PET imaging measure used to estimate tau protein accumulation in specific brain regions, measured using Standardized Uptake Value Ratio (SUVR) .
Tau PET Prediction: the estimation of tau accumulation patterns using computational models based on MRI or other biomarkers.
Related Content
Up-to-date information on best practices related to the use of neuroimaging in clinical trials of neurological diseases.
Longitudinal Change in Tau PET in MCI & Alzheimer’s Disease
An overview of the natural history of change in Tau PET tracer uptake & binding in Mild Cognitive Impairment (MCI) & Alzheimer’s disease (AD).
Surface-Based Subcortical Biomarkers in Parkinson’s Disease
Surface-based shape analysis of subcortical structures identifies sensitive biomarkers of Parkinson’s disease, predicting dopaminergic decline.
Tau-related Atrophy is Independent of β-Amyloid & APOE ε4
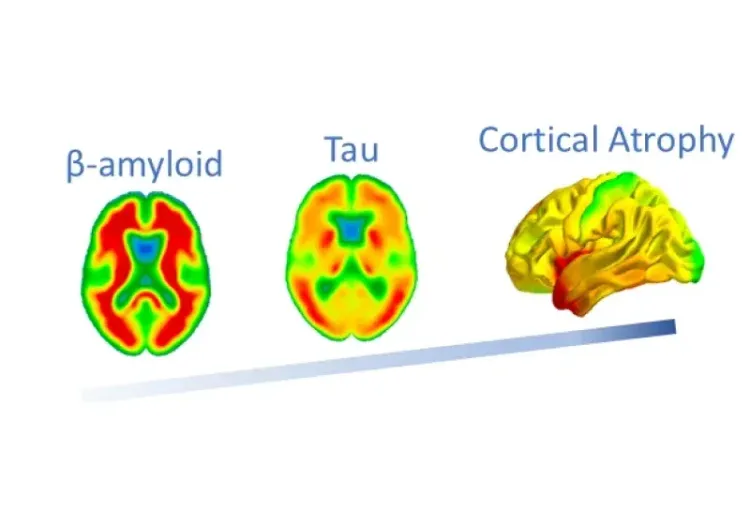
Using MRI, Tau PET, and Amyloid PET imaging biomarkers from the ADNI study, we show that Tau is more strongly linked to brain atrophy than β-amyloid or APOE ε4.